11

I have a small problem with ploting my graph. On a picture below is what I have already done.


The graph should represent the actual signal strength of available Wi-Fi network(s). It's a simple XYPlot here data are represented with SimpleXYSeries (values are dynamically created).

Here is a little snippet of code (only for example):

plot = (XYPlot) findViewById(R.id.simplexyPlot);
series1 = new SimpleXYSeries(Arrays.asList(series1Numbers),
SimpleXYSeries.ArrayFormat.Y_VALS_ONLY, "Link 1");
f1 = new LineAndPointFormatter(color.getColor(), null,
Color.argb(60, color.getRed(), color.getGreen(), color.getBlue()), null);
plot.addSeries(series1, f1);

The example in the picture is a dynamic simulation of dB changes. Everything works, I guess, correctly, but what I want to achieve is to have line with "rounded" corners (see the picture to see what I mean).

I already tried to customize LineFormatter:

f1.getFillPaint().setStrokeJoin(Join.ROUND);
f1.getFillPaint().setStrokeWidth(8);

But this didn't work as expected.

Enter image description here

Note: The Wifi Analyzer application has a similar graph and its graph has the rounded corners I want. It looks like this:

Enter image description here

Peter Mortensen
  • 30,738
  • 21
  • 105
  • 131
Simon Dorociak
  • 33,374
  • 10
  • 68
  • 106
  • You might find this post helpful, http://stackoverflow.com/a/7608516/2291915. getFillPaint() returns android's Paint object and from there you can use the Android methods to achieve the effect you desire. Best of luck. – buczek Aug 02 '13 at 15:45
  • @buczek thanks buddy but it didn't work as i hoped. But thanks for your opinion. – Simon Dorociak Aug 05 '13 at 06:12
  • Answer updated with screen of desired graph. thanks in advance. – Simon Dorociak Aug 05 '13 at 11:06

6 Answers6

11

You can use Path.cubicTo() method. It draws a line using cubic spline algorithm which results in the smoothing effect you want.

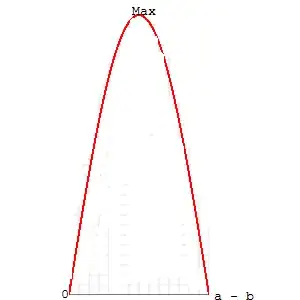
Checkout the answer to a similar question here, where a guy is talking about cubic splines. There is a short algorithm showing how to calculate input parameters for Path.cubicTo() method. You can play with divider values to achieve required smoothness. For example, in the picture below I divided by 5 instead of 3. Hope this helps.

Example of a polylyne drawn using Path.cubicTo() method

I have spent some time and implemented a SplineLineAndPointFormatter class, which does the stuff you need in androidplot library. It uses same technics. Here is how androidplot example applications looks like. You just need to use it instead of LineAndPointFormatter.

Androidplot example with SplineLineAndPointFormatter

Here is code example and the class I wrote.

f1 = new SplineLineAndPointFormatter(color.getColor(), null, 
      Color.argb(60, color.getRed(), color.getGreen(), color.getBlue()), null);
plot.addSeries(series1, f1);

Here is the class doing the magic. It is based on version 0.6.1 of androidplot library.

package com.androidplot.xy;

import android.graphics.Canvas;
import android.graphics.Path;
import android.graphics.PointF;
import android.graphics.RectF;

import com.androidplot.ui.SeriesRenderer;
import com.androidplot.util.ValPixConverter;

public class SplineLineAndPointFormatter extends LineAndPointFormatter {

    public SplineLineAndPointFormatter() { }

    public SplineLineAndPointFormatter(Integer lineColor, Integer vertexColor, Integer fillColor) {
        super(lineColor, vertexColor, fillColor, null);
    }

    public SplineLineAndPointFormatter(Integer lineColor, Integer vertexColor, Integer fillColor, FillDirection fillDir) {
        super(lineColor, vertexColor, fillColor, null, fillDir);
    }

    @Override
    public Class<? extends SeriesRenderer> getRendererClass() {
        return SplineLineAndPointRenderer.class;
    }

    @Override
    public SeriesRenderer getRendererInstance(XYPlot plot) {
        return new SplineLineAndPointRenderer(plot);
    }

    public static class SplineLineAndPointRenderer extends LineAndPointRenderer<BezierLineAndPointFormatter> {

        static class Point {
            public float x, y, dx, dy;
            public Point(PointF pf) { x = pf.x; y = pf.y; }
        }

        private Point prev, point, next;
        private int pointsCounter;

        public SplineLineAndPointRenderer(XYPlot plot) {
            super(plot);
        }

        @Override
        protected void appendToPath(Path path, final PointF thisPoint, PointF lastPoint) {
            pointsCounter--;

            if (point == null) {
                point = new Point(thisPoint);
                point.dx = ((point.x - prev.x) / 5);
                point.dy = ((point.y - prev.y) / 5);
                return;

            } else if (next == null) {
                next = new Point(thisPoint);
            } else {
                prev = point;
                point = next;
                next = new Point(thisPoint);
            }

            point.dx = ((next.x - prev.x) / 5);
            point.dy = ((next.y - prev.y) / 5);
            path.cubicTo(prev.x + prev.dx, prev.y + prev.dy, point.x - point.dx, point.y - point.dy, point.x, point.y);

            if (pointsCounter == 1) { // last point
                next.dx = ((next.x - point.x) / 5);
                next.dy = ((next.y - point.y) / 5);
                path.cubicTo(point.x + point.dx, point.y + point.dy, next.x - next.dx, next.y - next.dy, next.x, next.y);
            }

        }

        @Override
        protected void drawSeries(Canvas canvas, RectF plotArea, XYSeries series, LineAndPointFormatter formatter) {

            Number y = series.getY(0);
            Number x = series.getX(0);
            if (x == null || y == null) throw new IllegalArgumentException("no null values in xyseries permitted");

            XYPlot p = getPlot();
            PointF thisPoint = ValPixConverter.valToPix(x, y, plotArea,
                    p.getCalculatedMinX(), p.getCalculatedMaxX(), p.getCalculatedMinY(), p.getCalculatedMaxY());

            prev = new Point(thisPoint);
            point = next = null;
            pointsCounter = series.size();

            super.drawSeries(canvas, plotArea, series, formatter);
        }
    }
}
Community
  • 1
  • 1
sergej shafarenka
  • 20,071
  • 7
  • 67
  • 86
  • Thanks but i need graph and not Canvas to use. – Simon Dorociak Aug 21 '13 at 09:45
  • 1
    I have just updated by answer by adding SplineLineAndPointFormatter, which does the same for androidplot library. You can add this class to your project and use as described. – sergej shafarenka Aug 21 '13 at 12:53
  • Hello i have a little problem. I copied your stuff and error i did give: `The method drawSeries(Canvas, RectF, XYSeries, LineAndPointFormatter) of type SplineLineAndPointFormatter.SplineLineAndPointRenderer must override a superclass method` same with `appendToPath` – Simon Dorociak Aug 21 '13 at 13:20
  • Which androidplot version are you using? I took the actual one (master branch), directly from https://bitbucket.org/androidplot/androidplot/ – sergej shafarenka Aug 21 '13 at 13:28
  • Do you have some jar? – Simon Dorociak Aug 21 '13 at 13:49
  • Now, im getting NullPointerExeption at `super.drawSeries(canvas, plotArea, series, formatter);` – Simon Dorociak Aug 21 '13 at 14:13
  • 1
    It looks null-values are not allowed in the constructor anymore. The code below worked for me. `new SplineLineAndPointFormatter(Color.rgb(90, 90, 90), Color.rgb(80, 80, 80), Color.rgb(20, 20, 20), FillDirection.TOP);` – sergej shafarenka Aug 21 '13 at 14:21
  • I assume, that is the place where null-values were used, right? Can you use a transparent color instead? – sergej shafarenka Aug 21 '13 at 14:34
  • You need to define a paint with `Style.FILL` and set it to formatter using `setFillPaint()` method. I tried to use `configure()` method to set FillPaint, but it didn't work. Maybe they broke it somehow. Keep `FillDirection.BOTTOM` in constructor too. – sergej shafarenka Aug 21 '13 at 15:15
  • I included the class into androidplot library, recompiled it and uploaded to the server. Now you can download library and use the class from it. If you want to re-build the class, you need to clone the library from gitbucket, add `SplineLineAndPointFormatter` to it and recompile. This appears to be the right way to include it into the project. Here is the official snapshot + `SplineLineAndPointFormatter`: http://halfbit.de/d/androidplot-core-0.6.1-SNAPSHOT.jar – sergej shafarenka Aug 21 '13 at 15:34
  • FillDirection.BOTTOM made a trick! Thanks you, and now, only question. its possible (in some way) make titles above lines (look at question). Thanks in advance. – Simon Dorociak Aug 21 '13 at 21:29
  • 1
    I didn't find this option in library's source code. I would say it's not supported. – sergej shafarenka Aug 22 '13 at 05:09
  • Hello man. I have one question. How can i change stroke width? it seems it doesnt work with setStrokeWidth(). Can you help me? Thanks in advance. – Simon Dorociak Aug 29 '13 at 13:27
  • 1
    You create a `Paint` with style `Paint.STROKE` and call `setStrokeWidth()` on it. Just make sure you set it using `SplineLineAndPointFormatter.setLinePaint()`. – sergej shafarenka Aug 29 '13 at 15:41
  • The problem with using cubicTo this way is that it draws a line that "overshoots". For example, looking at the graphic above you can see that the highest actual yval is 8 but the line drawn actually goes as high as ~8.2. There's a [BezierLineAndPointRenderer](http://androidplot.com/javadoc/0.6.0/com/androidplot/xy/BezierLineAndPointRenderer.html|BezierLineAndPointRenderer) which uses quadTo for similar effect but suffers from the same flaw. The ultimate solution is probably to use [Catmull-Rom Splines](http://stackoverflow.com/questions/5602584/catmull-rom-splines-for-android). – Nick Sep 11 '13 at 14:49
  • @beworker Hello my friend. I need help. do you have still that library you updaded for me (with spline). I reinstalled pc and lost it...thanks in advance. – Simon Dorociak Feb 20 '14 at 12:42
  • @Sajmon Sorry man, I don't have it either. Just take actual library, put the class above into it and compile. It will work. – sergej shafarenka Feb 20 '14 at 14:11
  • 99.9% of users should *NOT* do this. The full rational and a more correct solution is available in my answer below. – Nick Dec 16 '15 at 15:28
8

1- I guess that you only use a few points to draw graphs of signals. All graph/chart applications try to connect points with direct lines and then your chart will be shown. So if you only use three points, your graph will looks like a triangle! If you want your graph to be curved, you have to add more points. Then it comes out like a curve.

2- Or you can find any library that can draw sin graph, for example GraphView Library. Then try to draw this function:

Enter image description here

So it looks like to this:

Enter image description here

Then translate it to (a,0), so result seems like what you want.

3- And another way, you can use built in Math.sin in Java:

Chose for example 1000 point in range a to b and compute value of above function for each point and finally create a path and show them in a canvas.

You can use quadTo (float x1, float y1, float x2, float y2) that simplify drawing quad curves for you. The documentation says:

Add a quadratic bezier from the last point, approaching control point (x1,y1), and ending at (x2,y2). If no moveTo() call has been made for this contour, the first point is automatically set to (0,0).

Parameters

x1 The x-coordinate of the control point on a quadratic curve
y1 The y-coordinate of the control point on a quadratic curve
x2 The x-coordinate of the end point on a quadratic curve
y2 The y-coordinate of the end point on a quadratic curve

Finally, I add a simple class that extends View and can draw a curve that looks like what you want:

public class SinWave extends View {

    private float first_X = 50;
    private float first_Y = 230;
    private float end_X = 100;
    private float end_Y = 230;
    private float Max = 50;

    public SinWave(Context context, AttributeSet attrs) {
        super(context, attrs);
    }

    @Override
    protected void onDraw(Canvas canvas) {
        super.onDraw(canvas);
        Paint paint = new Paint() {
            {
                setStyle(Paint.Style.STROKE);
                setStrokeCap(Paint.Cap.ROUND);
                setStrokeWidth(0.7f);
                setAntiAlias(true);
                setColor(0xFFFF00FF);
            }
        };
        final Path path = new Path();
        path.moveTo(first_X, first_Y);
        path.quadTo((first_X + end_X)/2, Max, end_X, end_Y);
        canvas.drawPath(path, paint);
    }
}

The result must look like this:

Enter image description here

You can add more methods to the class and change it to increase performance!

Peter Mortensen
  • 30,738
  • 21
  • 105
  • 131
hasanghaforian
  • 13,858
  • 11
  • 76
  • 167
  • @ can you provide some code? im not good in math enough. i dont like math. thanks in advance. – Simon Dorociak Aug 09 '13 at 07:18
  • Hi man, im here. So its nice but this is paint and i need to do it in some graph API. Could you do in in especially in AndroidPlot? thanks (sorry that im writing now, im busy in last days). – Simon Dorociak Aug 12 '13 at 06:59
  • Ok man. i will give you bounty because it works but its not what i wanted. i'll continue to looking for. – Simon Dorociak Aug 12 '13 at 11:23
1

In some simple cases, this could help:

mPaint.pathEffect = CornerPathEffect(radius)

even in combination with

path.lineTo(x,y)
G F
  • 11
  • 1
  • 1
0

There's always been a smooth line renderer in Androidplot: BezierLineAndPointRenderer, which like the implementations above uses Android's built in Bezier drawing routines cubicTo(...) & quadTo(...). The problem is that using Beziers to draw smooth lines in this way creates a false line that overshoots the actual control points by varying amounts, which you can see happening if you look closely at the image above.

The solution is to use the Catmull-Rom spline interpolation, which is now finally supported by Androidplot. Details here: http://androidplot.com/smooth-curves-and-androidplot/

Nick
  • 8,181
  • 4
  • 38
  • 63
0

Just use ChartFactory.getCubeLineChartView instead of ChartFactory.getLineChartView using achart engine

Vikas
  • 1
  • 2
-1

try this:

symbol = new Path();
paint = new Paint();
paint.setAntiAlias(true);      
paint.setStrokeWidth(2);
paint.setColor(-7829368);  
paint.setStrokeJoin(Paint.Join.ROUND);    // set the join to round you want
paint.setStrokeCap(Paint.Cap.ROUND);      // set the paint cap to round too
paint.setPathEffect(new CornerPathEffect(10) );
paint.setStyle(Paint.Style.STROKE);       

symbol.moveTo(50.0F, 230.0F);         
symbol.lineTo(75.0F, 100.0F);
symbol.lineTo(100.0F, 230.0F);

most of the info found here

Community
  • 1
  • 1
Pontios
  • 2,377
  • 27
  • 32