Chrome debugger stops working at some point. As you all know sometime the execution is stopped in jquery.js file at some unknown point and we can resume execution using resume button, but sometimes it happens that that button doesn't work and the only way to resume execution is you have to close the debugger, no other buttons in the debugger window works. I am seeing this from long time since I started using debugger, but I never came to know why this happens.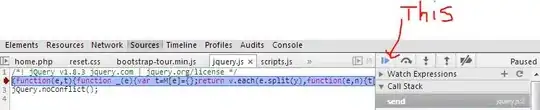
I want to know why it happens that pause of execution is shown in the jquery.js file, a pause which is not set by me. when such pause occurs the button in the image below does not work, not even any other button in the window works.
Can anybody tell me why this happens?