9

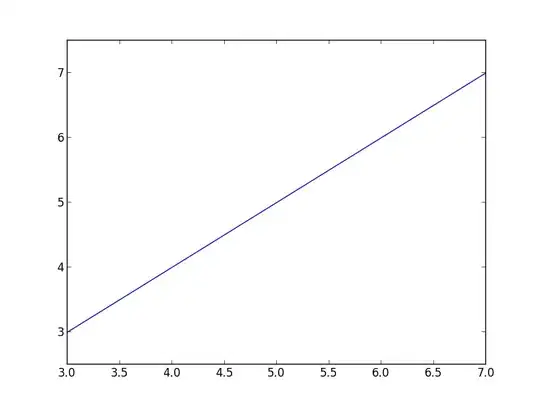
For example, after I set xlim, the ylim is wider than the range of data points shown on the screen. Of course, I can manually pick a range and set it, but I would prefer if it is done automatically.

Or, at least, how can we determine y-range of data points shown on screen?

plot right after I set xlim: plot right after I set xlim

plot after I manually set ylim: plot after I manually set ylim

Saullo G. P. Castro
  • 56,802
  • 26
  • 179
  • 234
Liang
  • 1,015
  • 1
  • 10
  • 13

3 Answers3

7

This approach will work in case y(x) is non-linear. Given the arrays x and y that you want to plot:

lims = gca().get_xlim()
i = np.where( (x > lims[0]) &  (x < lims[1]) )[0]
gca().set_ylim( y[i].min(), y[i].max() )
show()
Saullo G. P. Castro
  • 56,802
  • 26
  • 179
  • 234
  • 1
    Thanks Saullo, however, autoscale(axis='y') still calculates the data range from the full data set, including data points not shown on the screen – Liang Aug 11 '13 at 15:17
  • Thank you for the feedback.. I've updated the answer for a case where `y(x)` is non-linear... – Saullo G. P. Castro Aug 11 '13 at 22:22
2

To determine the y range you can use

ax = plt.subplot(111)
ax.plot(x, y)
y_lims = ax.get_ylim()

which will return a tuple of the current y limits.

It seems however that you will probably need to automate setting the y limits by finding the value of y data at at your x limits. There are many ways to do this, my suggestion would be this:

import matplotlib.pylab as plt
ax = plt.subplot(111)
x = plt.linspace(0, 10, 1000)
y = 0.5 * x
ax.plot(x, y)
x_lims = (2, 4)
ax.set_xlim(x_lims)

# Manually find y minimum at x_lims[0]
y_low = y[find_nearest(x, x_lims[0])]
y_high = y[find_nearest(x, x_lims[1])]
ax.set_ylim(y_low, y_high)

where the function is with credit to unutbu in this post

import numpy as np
def find_nearest(array,value):
    idx = (np.abs(array-value)).argmin()
    return idx

This however will have issues when the data y data is not linear.

Community
  • 1
  • 1
Greg
  • 11,654
  • 3
  • 44
  • 50
  • 1
    To me, your answer is the least confusing way. But there could be a quick improvement, that we may find y_low and y_high by taking the min and max between y[find_nearest(x, x_lims[0])] and y[find_nearest(x, x_lims[1])], that is: `y_low = y[find_nearest(x, x_lims[0]):find_nearest(x, x_lims[1])].min() y_high = y[find_nearest(x, x_lims[0]):find_nearest(x, x_lims[1])].max()`. – Liang Aug 11 '13 at 22:01
2

I found @Saullo Castro's answer useful and have slightly improved it. Chances are that you want to do adjust limits many different plots.

import numpy as np
def correct_limit(ax, x, y):   
   # ax: axes object handle
   #  x: data for entire x-axes
   #  y: data for entire y-axes
   # assumption: you have already set the x-limit as desired
   lims = ax.get_xlim()
   i = np.where( (x > lims[0]) &  (x < lims[1]) )[0]
   ax.set_ylim( y[i].min(), y[i].max() ) 
wander95
  • 1,298
  • 1
  • 15
  • 22