47

I'm trying to compare images to each other to find out whether they are different. First I tried to make a Pearson correleation of the RGB values, which works also quite good unless the pictures are a litte bit shifted. So if a have a 100% identical images but one is a little bit moved, I get a bad correlation value.

Any suggestions for a better algorithm?

BTW, I'm talking about to compare thousand of imgages...

Edit: Here is an example of my pictures (microscopic):

im1:

enter image description here

im2:

enter image description here

im3:

enter image description here

im1 and im2 are the same but a little bit shifted/cutted, im3 should be recognized as completly different...

Edit: Problem is solved with the suggestions of Peter Hansen! Works very well! Thanks to all answers! Some results can be found here http://labtools.ipk-gatersleben.de/image%20comparison/image%20comparision.pdf

honeymoon
  • 2,400
  • 5
  • 34
  • 43
  • 1
    If you are more spcific in what type of pictures you have, and in what ways they can be different (scale, rotation, lighting, ...) it will be much easier to give a good answer and solution. – Hannes Ovrén Nov 30 '09 at 11:49
  • There are a number of questions like this already. http://stackoverflow.com/questions/336067/detecting-if-two-images-are-visually-identical http://stackoverflow.com/questions/189943/how-can-i-quantify-difference-between-two-images http://stackoverflow.com/questions/336067/detecting-if-two-images-are-visually-identical This one's about microscopy, too: http://stackoverflow.com/questions/967436/checking-image-feature-alignment – endolith Dec 01 '09 at 19:14
  • In addition to these excellent answers - it's generally best to compare real world images in HSV space rather RGB. – Martin Beckett Dec 07 '09 at 15:20
  • @mgb, that's correct. Note that my answer does use luminosity, with an algorithm suggested by W3C. That one's not necessarily the best as a general choice, but should be okay for this use. – Peter Hansen Dec 08 '09 at 13:27

9 Answers9

39

A similar question was asked a year ago and has numerous responses, including one regarding pixelizing the images, which I was going to suggest as at least a pre-qualification step (as it would exclude very non-similar images quite quickly).

There are also links there to still-earlier questions which have even more references and good answers.

Here's an implementation using some of the ideas with Scipy, using your above three images (saved as im1.jpg, im2.jpg, im3.jpg, respectively). The final output shows im1 compared with itself, as a baseline, and then each image compared with the others.

>>> import scipy as sp
>>> from scipy.misc import imread
>>> from scipy.signal.signaltools import correlate2d as c2d
>>>
>>> def get(i):
...     # get JPG image as Scipy array, RGB (3 layer)
...     data = imread('im%s.jpg' % i)
...     # convert to grey-scale using W3C luminance calc
...     data = sp.inner(data, [299, 587, 114]) / 1000.0
...     # normalize per http://en.wikipedia.org/wiki/Cross-correlation
...     return (data - data.mean()) / data.std()
...
>>> im1 = get(1)
>>> im2 = get(2)
>>> im3 = get(3)
>>> im1.shape
(105, 401)
>>> im2.shape
(109, 373)
>>> im3.shape
(121, 457)
>>> c11 = c2d(im1, im1, mode='same')  # baseline
>>> c12 = c2d(im1, im2, mode='same')
>>> c13 = c2d(im1, im3, mode='same')
>>> c23 = c2d(im2, im3, mode='same')
>>> c11.max(), c12.max(), c13.max(), c23.max()
(42105.00000000259, 39898.103896795357, 16482.883608327804, 15873.465425120798)

So note that im1 compared with itself gives a score of 42105, im2 compared with im1 is not far off that, but im3 compared with either of the others gives well under half that value. You'd have to experiment with other images to see how well this might perform and how you might improve it.

Run time is long... several minutes on my machine. I would try some pre-filtering to avoid wasting time comparing very dissimilar images, maybe with the "compare jpg file size" trick mentioned in responses to the other question, or with pixelization. The fact that you have images of different sizes complicates things, but you didn't give enough information about the extent of butchering one might expect, so it's hard to give a specific answer that takes that into account.

Community
  • 1
  • 1
Peter Hansen
  • 21,046
  • 5
  • 50
  • 72
  • Thanks for your implementation! I'm trying it at the moment in a test run. In case that it's successfull I can think about filtering first. Compare size sounds good, I also might try resizing... – honeymoon Dec 01 '09 at 08:54
  • 3
    It's look like that this methode works very well!!! I got a clear result with my positive control! With resizing the pics to 50%, I gained a lot of speed. Thanks a lot! – honeymoon Dec 01 '09 at 16:52
  • You're welcome. I also experimented with FFTs and, considering your description of your images ("identical" but maybe shifted and/or clipped) I think an FFT might do well if you use the magnitude result only. This time I clipped the images to the minimum common dimensions, did a scipy.fftpack.fft2 then abs() on each to get f1, f2, f3, and did a normalized compare with the baseline image using (f1-x)**2/f1/x where x was f1, f2, f3, etc. Results are 0, 143, 211 respectively. With brightness-adjusted and noisified versions of im1 I got 146 and 1189 results for those. Run time only 1.2s... – Peter Hansen Dec 01 '09 at 17:34
  • 1
    Oh, I have to try this out! The sensitivity of this methode is amazing! I'll post an example, to show how great it's works! It's really powerfull! Up to now all implementations failed on shifted pictures ;-) – honeymoon Dec 01 '09 at 17:45
  • 1
    For those who are intersted, some results: http://www.file-upload.net/download-2054026/image_comparision.pdf.html Kind regards and thanks to all! – honeymoon Dec 03 '09 at 13:36
  • Note that the file-upload.net link that snowflake posted in the comment above is now dead, sadly. – Peter Hansen May 09 '12 at 01:26
  • 1
    I changed the link, it's online again: http://labtools.ipk-gatersleben.de/image%20comparison/image%20comparision.pdf – honeymoon May 09 '12 at 06:54
  • 1
    I'm using this solution in my panoramic algorithm and it works like a charm. It can be a bit slow but using what snowflake said, it seems to work a lot quicker. Thanks to you both - it is greatly appreciated! – Brandon Sep 15 '13 at 05:27
  • What do the output values mean? 42105.00000000259, 39898.103896795357, 16482.883608327804, 15873 Why does comparing same file (im1) to itself yield 42105? – Doug Null Apr 30 '17 at 21:04
  • @DougNull I don't know exactly and I'm not sure it matters for this application, as "it's all relative". The self-correlation provides you with the max possible value. The less similar another image is, the lower the value will be relative to that. I think you'd need to study https://docs.scipy.org/doc/scipy-0.18.1/reference/generated/scipy.signal.correlate2d.html and background material to find a direct answer to your question. – Peter Hansen May 01 '17 at 22:36
  • @DougNull, I just happened by here again and realized that it would probably have been better if I'd used the self-correlation value to normalize everything (divide all answers by that value). Then the image itself would be 1.0, and everything different would be less. Probably what I had in mind at the time, though not sure why I didn't think of that when responding to your comment two months ago. – Peter Hansen Jul 03 '17 at 15:15
14

I have one done this with an image histogram comparison. My basic algorithm was this:

  1. Split image into red, green and blue
  2. Create normalized histograms for red, green and blue channel and concatenate them into a vector (r0...rn, g0...gn, b0...bn) where n is the number of "buckets", 256 should be enough
  3. subtract this histogram from the histogram of another image and calculate the distance

here is some code with numpy and pil

r = numpy.asarray(im.convert( "RGB", (1,0,0,0, 1,0,0,0, 1,0,0,0) ))
g = numpy.asarray(im.convert( "RGB", (0,1,0,0, 0,1,0,0, 0,1,0,0) ))
b = numpy.asarray(im.convert( "RGB", (0,0,1,0, 0,0,1,0, 0,0,1,0) ))
hr, h_bins = numpy.histogram(r, bins=256, new=True, normed=True)
hg, h_bins = numpy.histogram(g, bins=256, new=True, normed=True)
hb, h_bins = numpy.histogram(b, bins=256, new=True, normed=True)
hist = numpy.array([hr, hg, hb]).ravel()

if you have two histograms, you can get the distance like this:

diff = hist1 - hist2
distance = numpy.sqrt(numpy.dot(diff, diff))

If the two images are identical, the distance is 0, the more they diverge, the greater the distance.

It worked quite well for photos for me but failed on graphics like texts and logos.

Otto Allmendinger
  • 27,448
  • 7
  • 68
  • 79
  • 4
    Just to emphasize: Even though two histograms are equal it does not necessarily imply that the two images that generated them are in any way structurally similar. They just happen to have the same distribution of colors. The US and UK flags will probably generate similar histograms, to take one example. – Hannes Ovrén Nov 30 '09 at 11:52
8

If your problem is about shifted pixels, maybe you should compare against a frequency transform.

The FFT should be OK (numpy has an implementation for 2D matrices), but I'm always hearing that Wavelets are better for this kind of tasks ^_^

About the performance, if all the images are of the same size, if I remember well, the FFTW package created an specialised function for each FFT input size, so you can get a nice performance boost reusing the same code... I don't know if numpy is based on FFTW, but if it's not maybe you could try to investigate a little bit there.

Here you have a prototype... you can play a little bit with it to see which threshold fits with your images.

import Image
import numpy
import sys

def main():
    img1 = Image.open(sys.argv[1])
    img2 = Image.open(sys.argv[2])

    if img1.size != img2.size or img1.getbands() != img2.getbands():
        return -1

    s = 0
    for band_index, band in enumerate(img1.getbands()):
        m1 = numpy.fft.fft2(numpy.array([p[band_index] for p in img1.getdata()]).reshape(*img1.size))
        m2 = numpy.fft.fft2(numpy.array([p[band_index] for p in img2.getdata()]).reshape(*img2.size))
        s += numpy.sum(numpy.abs(m1-m2))
    print s

if __name__ == "__main__":
    sys.exit(main())

Another way to proceed might be blurring the images, then subtracting the pixel values from the two images. If the difference is non nil, then you can shift one of the images 1 px in each direction and compare again, if the difference is lower than in the previous step, you can repeat shifting in the direction of the gradient and subtracting until the difference is lower than a certain threshold or increases again. That should work if the radius of the blurring kernel is larger than the shift of the images.

Also, you can try with some of the tools that are commonly used in the photography workflow for blending multiple expositions or doing panoramas, like the Pano Tools.

fortran
  • 74,053
  • 25
  • 135
  • 175
  • The problem with this approach is that (natural) photographs generally have very similar frequency content. So an FFT alone will most likely not work very well. I would assume that this is true for quite a lot of other domains of subjects as well. – Hannes Ovrén Nov 30 '09 at 11:42
  • 1
    @kigurai I made some test with images with the same kind of "natural" content (two different nuclear explosions, they're easy to find, search for "test" in google images) and another picture of the London Eye and they scored 41583454 and 45014233 in my quick and dirty FFT test... One of the explosions shifted 3 pixels to the right (filling with white) scores just 8749886 (4x less) and with 15 pixels shift still 17325409 (2x less). The very same image of course scores 0. So the trivial FFT seems a very good way to compare, despite your objection. – fortran Nov 30 '09 at 13:25
  • I tried your code on three examples and it's looks quite promising! I started now an overnigt run! Thanks a lot! – honeymoon Nov 30 '09 at 16:17
  • You're welcome... and I'm glad that my course on signal processing was useful at last xD – fortran Nov 30 '09 at 17:14
  • Have the first results...Looks not very good. Principally it's work but not sensitive enough. Many false positive before a real duplicate comes. At least I come closer...This pics are really nasty, this two for instance got the best hit to 0: http://www9.picfront.org/picture/1UwuRQAw9ol/img/14B_033_01.jpg http://www7.picfront.org/picture/aPbgLAFg9NY/img/14B_038_01.jpg The stupid is that actually I have to work on the microscope and no time for programming but it's really an interesting task...Can't stop ;-) Keep reading, coding, trying... – honeymoon Nov 30 '09 at 17:49
  • @fortran I have not done any exhaustive testing myself but I have never seen any computer vision method for image similarity that involves anything so simple. Also, it was proposed by my professors that so is the case. And it seems to be verified by the OP ;) – Hannes Ovrén Nov 30 '09 at 18:42
  • @kigurai the question seemed simple too, just to detect if an image was shifted... the frequencies shouldn't change in the ideal case (an infinite canvas), but I guess too much information is lost in the lowest ones with the cropping :-s @op then I suggest you to take a look to the align_image_stack, I think it provides some kind of feedback when the correlation values are too different (at least in QtPFSGui it does), it should be just a matter of playing with the command line tool and scripting a little bit. – fortran Nov 30 '09 at 20:58
  • @fortran: I agree: Shifting the image should not change the frequency content much. The problem I see is that all the images will have a very similar frequency content, so using that as a feature for image comparison will be very flaky. – Hannes Ovrén Dec 02 '09 at 10:11
8

You really need to specify the question better, but, looking at those 5 images, the organisms all seem to be oriented the same way. If this is always the case, you can try doing a normalized cross-correlation between the two images and taking the peak value as your degree of similarity. I don't know of a normalized cross-correlation function in Python, but there is a similar fftconvolve() function and you can do the circular cross-correlation yourself:

a = asarray(Image.open('c603225337.jpg').convert('L'))
b = asarray(Image.open('9b78f22f42.jpg').convert('L'))
f1 = rfftn(a)
f2 = rfftn(b)
g =  f1 * f2
c = irfftn(g)

This won't work as written since the images are different sizes, and the output isn't weighted or normalized at all.

The location of the peak value of the output indicates the offset between the two images, and the magnitude of the peak indicates the similarity. There should be a way to weight/normalize it so that you can tell the difference between a good match and a poor match.

This isn't as good of an answer as I want, since I haven't figured out how to normalize it yet, but I'll update it if I figure it out, and it will give you an idea to look into.

endolith
  • 25,479
  • 34
  • 128
  • 192
3

I have done some image processing course long ago, and remember that when matching I normally started with making the image grayscale, and then sharpening the edges of the image so you only see edges. You (the software) can then shift and subtract the images until the difference is minimal.

If that difference is larger than the treshold you set, the images are not equal and you can move on to the next. Images with a smaller treshold can then be analyzed next.

I do think that at best you can radically thin out possible matches, but will need to personally compare possible matches to determine they're really equal.

I can't really show code as it was a long time ago, and I used Khoros/Cantata for that course.

extraneon
  • 23,575
  • 2
  • 47
  • 51
2

First off, correlation is a very CPU intensive rather inaccurate measure for similarity. Why not just go for the sum of the squares if differences between individual pixels?

A simple solution, if the maximum shift is limited: generate all possible shifted images and find the one that is the best match. Make sure you calculate your match variable (i.e. correllation) only over the subset of pixels that can be matched in all shifted images. Also, your maximum shift should be significantly smaller than the size of your images.

If you want to use some more advances image processing techniques I suggest you look at SIFT this is a very powerfull method that (theoretically anyway) can properly match items in images independent of translation, rotation and scale.

jilles de wit
  • 7,060
  • 3
  • 26
  • 50
2

To get the imports to work correctly on my Ubuntu 16.04 (as of April 2017), I installed python 2.7 and these:

sudo apt-get install python-dev
sudo apt-get install libtiff5-dev libjpeg8-dev zlib1g-dev libfreetype6-dev liblcms2-dev libwebp-dev tcl8.6-dev tk8.6-dev python-tk
sudo apt-get install python-scipy
sudo pip install pillow

Then I changed Snowflake's imports to these:

import scipy as sp
from scipy.ndimage import imread
from scipy.signal.signaltools import correlate2d as c2d

How awesome that Snowflake's scripted worked for me 8 years later!

Peter Hansen
  • 21,046
  • 5
  • 50
  • 72
Doug Null
  • 7,989
  • 15
  • 69
  • 148
1

I guess you could do something like this:

  • estimate vertical / horizontal displacement of reference image vs the comparison image. a simple SAD (sum of absolute difference) with motion vectors would do to.

  • shift the comparison image accordingly

  • compute the pearson correlation you were trying to do

Shift measurement is not difficult.

  • Take a region (say about 32x32) in comparison image.
  • Shift it by x pixels in horizontal and y pixels in vertical direction.
  • Compute the SAD (sum of absolute difference) w.r.t. original image
  • Do this for several values of x and y in a small range (-10, +10)
  • Find the place where the difference is minimum
  • Pick that value as the shift motion vector

Note:

If the SAD is coming very high for all values of x and y then you can anyway assume that the images are highly dissimilar and shift measurement is not necessary.

Shailesh Kumar
  • 6,457
  • 8
  • 35
  • 60
  • 1
    There are a lot more sophisticated motion estimation ("Shift measurement") algorithms around. Your method will fail miserably if the region you check is chosen badly (not intrinsically 2D). – Hannes Ovrén Nov 30 '09 at 11:38
  • 1
    For reference: One of the "standard" motion estimation algorithms is the Lucas-Kanade tracker. – Hannes Ovrén Nov 30 '09 at 11:40
1

I propose a solution based on the Jaccard index of similarity on the image histograms. See: https://en.wikipedia.org/wiki/Jaccard_index#Weighted_Jaccard_similarity_and_distance

You can compute the difference in the distribution of the pixel colors. This is indeed pretty invariant to translations.

from PIL.Image import Image
from typing import List

def jaccard_similarity(im1: Image, im2: Image) -> float:
    """Compute the similarity between two images.
    First, for each image an histogram of the pixels distribution is extracted.
    Then, the similarity between the histograms is compared using the weighted Jaccard index of similarity, defined as:
    Jsimilarity = sum(min(b1_i, b2_i)) / sum(max(b1_i, b2_i)
    where b1_i, and b2_i are the ith histogram bin of images 1 and 2, respectively.

    The two images must have same resolution and number of channels (depth).

    See: https://en.wikipedia.org/wiki/Jaccard_index
    Where it is also called Ruzicka similarity."""

    if im1.size != im2.size:
        raise Exception("Images must have the same size. Found {} and {}".format(im1.size, im2.size))

    n_channels_1 = len(im1.getbands())
    n_channels_2 = len(im2.getbands())
    if n_channels_1 != n_channels_2:
        raise Exception("Images must have the same number of channels. Found {} and {}".format(n_channels_1, n_channels_2))

    assert n_channels_1 == n_channels_2

    sum_mins = 0
    sum_maxs = 0

    hi1 = im1.histogram()  # type: List[int]
    hi2 = im2.histogram()  # type: List[int]

    # Since the two images have the same amount of channels, they must have the same amount of bins in the histogram.
    assert len(hi1) == len(hi2)

    for b1, b2 in zip(hi1, hi2):
        min_b = min(b1, b2)
        sum_mins += min_b
        max_b = max(b1, b2)
        sum_maxs += max_b

    jaccard_index = sum_mins / sum_maxs

    return jaccard_index

With respect to mean squared error, the Jaccard index lies always in the range [0,1], thus allowing for comparisons among different image sizes.

Then, you can compare the two images, but after rescaling to the same size! Or pixel counts will have to be somehow normalized. I used this:

import sys

from skincare.common.utils import jaccard_similarity

import PIL.Image
from PIL.Image import Image

file1 = sys.argv[1]
file2 = sys.argv[2]

im1 = PIL.Image.open(file1)  # type: Image
im2 = PIL.Image.open(file2)  # type: Image

print("Image 1: mode={}, size={}".format(im1.mode, im1.size))
print("Image 2: mode={}, size={}".format(im2.mode, im2.size))

if im1.size != im2.size:
    print("Resizing image 2 to {}".format(im1.size))
    im2 = im2.resize(im1.size, resample=PIL.Image.BILINEAR)

j = jaccard_similarity(im1, im2)
print("Jaccard similarity index = {}".format(j))

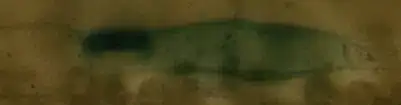
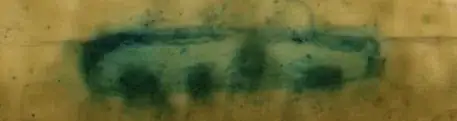
Testing on your images:

$ python CompareTwoImages.py im1.jpg im2.jpg
Image 1: mode=RGB, size=(401, 105)
Image 2: mode=RGB, size=(373, 109)
Resizing image 2 to (401, 105)
Jaccard similarity index = 0.7238955686269157
$ python CompareTwoImages.py im1.jpg im3.jpg 
Image 1: mode=RGB, size=(401, 105)
Image 2: mode=RGB, size=(457, 121)
Resizing image 2 to (401, 105)
Jaccard similarity index = 0.22785529941822316
$ python CompareTwoImages.py im2.jpg im3.jpg 
Image 1: mode=RGB, size=(373, 109)
Image 2: mode=RGB, size=(457, 121)
Resizing image 2 to (373, 109)
Jaccard similarity index = 0.29066426814105445

You might also consider experimenting with different resampling filters (like NEAREST or LANCZOS), as they, of course, alter the color distribution when resizing.

Additionally, consider that swapping images change the results, as the second image might be downsampled instead of upsampled (After all, cropping might better suit your case rather than rescaling.)

fnunnari
  • 159
  • 2
  • 11