4

I ran my app in Instruments with the VM Tracker a discovered a growing Image IO memory consumption.

Instruments with initWithContentsOfFile:

Effectively, the app did quite a bit of reading images from disk with initWithContentsOfFile:. I read once that this method was the spawn of Satan, so I replaced it with the following:

NSData *data = [NSData dataWithContentsOfFile:path];
UIImage *image = [UIImage imageWithData:data];

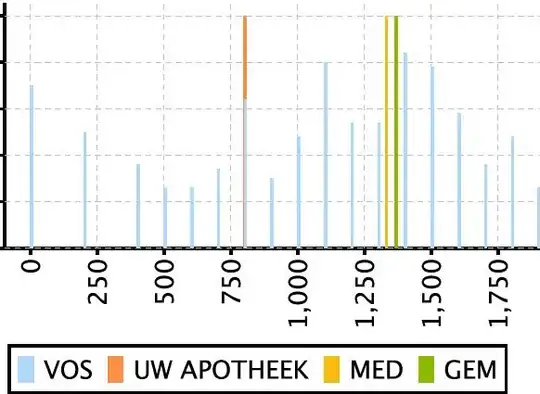
This reduced virtual memory greatly (about 60%), as shown below:

Instruments with imageWithData:

But, why does the Image IO virtual memory keep growing over time, when there aren't any leaks and my app is just using 15MB of live memory?

Is there something I can do to make sure that this Image IO memory is released?

Basically, the image reading from disk is done like this:

dispatch_async(dispatch_get_global_queue(DISPATCH_QUEUE_PRIORITY_DEFAULT, 0ul), ^(void) {
    NSData *data = [NSData dataWithContentsOfFile:path];
    UIImage *image = [UIImage imageWithData:data];
    dispatch_async(dispatch_get_main_queue(), ^{
        imageView.image = image;
    });
});

I also tried the following without any significant changes:

  • Use [NSData dataWithContentsOfFile:path options:NSDataReadingUncached error:nil] instead
  • Move UIImage *image = [UIImage imageWithData:data]; to the main queue
  • Do everything on the main queue

Which makes me think the problem might be elsewhere.

hpique
  • 119,096
  • 131
  • 338
  • 476
  • In the Allocations instrument you can turn all recording of call stacks for allocation events. Maybe you have an extra accidental retain sonewhere? – nielsbot Aug 15 '13 at 15:37
  • @nielsbot If there were, wouldn't the live memory be much higher then (closer to the virtual memory)? That said, I have checked for leaks both in Instruments and in the static analyser. – hpique Aug 15 '13 at 15:43
  • I guess I'm curious about the source of the allocations mainly. – nielsbot Aug 15 '13 at 16:41
  • @nielsbot Here you go :) http://imgur.com/UowiGKR – hpique Aug 15 '13 at 16:59
  • Ok--so looks like it's a lot of CFData objects... If you click the show detail arrow next to CFData then browse the instances, look at the recorded call stacks for each allocation event to see the cause of the allocation. – nielsbot Aug 15 '13 at 17:53
  • Just a guess: It looks like you're creating a lot of NSData objects in a loop (maybe on a background thread). So the problem could be that the data objects all end up in an undrained autorelease pool. – Nikolai Ruhe Aug 15 '13 at 17:59
  • @nielsbot Can't find user code in the stack trace of those objects. – hpique Aug 16 '13 at 08:35
  • @NikolaiRuhe Yes, I do. I edited the question with the possibly offending code. Any idea of what might be wrong? – hpique Aug 16 '13 at 08:46

2 Answers2

2

You should at least wrap the background processing into an autorelease pool:

dispatch_async(dispatch_get_global_queue(DISPATCH_QUEUE_PRIORITY_DEFAULT, 0ul), ^(void) {
    @autoreleasepool {
        NSData *data = [NSData dataWithContentsOfFile:path];
        UIImage *image = [UIImage imageWithData:data];
        dispatch_async(dispatch_get_main_queue(), ^{
            imageView.image = image;
        });
    }
});

This way you make sure any autoreleased objects on the background thread go away as fast as possible.

Nikolai Ruhe
  • 81,520
  • 17
  • 180
  • 200
  • Doesn't ARC make this unnecessary? Isn't it smart enough to know that `data` can be released after `imageWithData:` and that `image` can be released at the end of the second `dispatch_async`? – hpique Aug 16 '13 at 10:31
  • @hpique No. There's a chance that ARC can sometimes avoid putting objects into an autorelease pool if optimization is turned on and both caller and callee are compiled using ARC but you can't rely on that. Here `dataWithContentsOfFile:` creates an autoreleased object that goes away faster if the pool is added. – Nikolai Ruhe Aug 16 '13 at 12:23
1

Thanks to Heapshot Analysis I found that the images were retained by a NSCache.

The problem was that the NSCache didn't release any objects on memory warning. The solution: make it observe UIApplicationDidReceiveMemoryWarningNotification and remove all of its objects when this happens. This is how Instruments looks now:

Instruments with memory warning draining

Instruments is awesome. Thanks to @NikolaiRuhe and @nielsbot for making me dig deeper.

Also, I should add that memory consumption lowered when using NSData because dataWithContentsOfFiledoesn't account for retina files (d'uh). So imageWithContentsOfFile: might still be the spawn of Satan, but this one wasn't its fault.

Community
  • 1
  • 1
hpique
  • 119,096
  • 131
  • 338
  • 476
  • You could also try passing `NSDataReadingMappedAlways` to `dataWithContentsOfURL:options:error:` as well – nielsbot Aug 16 '13 at 22:41