457

I'm looking for some good tools/scripts that allow me to generate a few statistics from a git repository. I've seen this feature on some code hosting sites, and they contained information like...

  • commits per author
  • commits per day/week/year/etc.
  • lines of code over time
  • graphs
  • ... much more

Basically I just want to get an idea how much my project grows over time, which developer commits most code, and so on.

tshepang
  • 12,111
  • 21
  • 91
  • 136
BastiBen
  • 19,679
  • 11
  • 56
  • 86
  • 3
    If you cannot install gitstats, you can at least get the **number of lines of code by author** using basic git commands: `git ls-files | while read f; do git blame -w -M -C -C --line-porcelain "$f" | grep -I '^author '; done | sort -f | uniq -ic | sort -n --reverse` – hartmut Dec 03 '20 at 12:12

11 Answers11

354

commits per author

git shortlog -s -n 
Ruslan Kabalin
  • 6,580
  • 2
  • 28
  • 20
  • 91
    exclude merges: `git shortlog -sn --no-merges` – doblak Feb 05 '15 at 06:42
  • 9
    e flag gives you committers email address `git shortlog -sne` – Kalpa Gunarathna Jun 22 '16 at 02:30
  • 3
    Personally I am more interested in how many lines each person was the last one to touch, or total number of lines changed per person. Commits per author is also interesting though. – Nathan Loyer Aug 17 '18 at 01:05
  • 21
    `git shortlog -s -n --since "DEC 31 2017"` if you want to filter since a given date. Great for annual reviews ;) – Eneko Alonso Dec 14 '18 at 21:47
  • 5
    @EnekoAlonso I recommend against using such metrics to measure developer performance. You will likely see false positives masking poor development practices, while some of the best developers will go unnoticed. There is no correlation between number of commits and developer performance, aside from 0 or way, way, way too many. – Todd Mar 04 '20 at 18:45
  • 2
    @Todd 100% agree. I meant it as a joke – Eneko Alonso Mar 04 '20 at 18:50
302

Beside GitStats (git history statistics generator) mentioned by xyld, written in Python and requiring Gnuplot for graphs, there is also

Community
  • 1
  • 1
Jakub Narębski
  • 309,089
  • 65
  • 217
  • 230
  • 1
    see xyld's answer. gitstats (not gitstat) is probably your best bet. – Jay Paroline Aug 13 '10 at 11:37
  • I got gitstats to install after installing readline-6.2.tar.gz and gnuplot. But then found it was missing the libraries necessary to produce the stat images, resulting in missing pngs when viewing gitstats output. So pretty much followed this to get it working correctly: http://www.dansanderson.com/blog/2011/03/installing-gnuplot-on-mac-os-x-106.html – David van Dugteren Feb 13 '13 at 23:11
  • For reference, this set of tools is really nice and simple : https://github.com/dustin/bindir. They are based on [google pithon chart](http://pygooglechart.slowchop.com/pygooglechart/wiki) and are simple to use : http://dustin.github.io/2009/01/11/timecard.html – Snicolas May 25 '13 at 16:44
  • 2
    There's even a Mac App for it: https://itunes.apple.com/us/app/gitstatx/id592679713?mt=12 – pgpb.padilla Feb 04 '14 at 05:00
  • 4
    Cool, this simply works: `apt-get install gitstats`. Then run it on a git directory like this: `gitstats ~/gitdir /tmp/output` – Luc Feb 01 '15 at 14:21
  • Graphs for "stars", "forks", "pulls", "issues", "commits" and more: http://stackoverflow.com/a/31344479/924017 – Henry Ruhs Aug 31 '15 at 06:14
  • Related question: http://stackoverflow.com/questions/6610525/how-to-generate-stats-for-a-github-project – Jakub Narębski Aug 31 '15 at 06:52
  • I couldn't edit this answer to add [git-stats](https://github.com/IonicaBizau/git-stats) which is easy to install `npm install -g git-stats` and has great features. You can obtain a graph right on the CLI with commits per author with `git-stats --authors` – cirovladimir Mar 12 '19 at 15:01
  • `apt-get install gitstats` seems not to work anymore – Martin Thoma Sep 07 '21 at 06:48
  • Hi all, just finished this cli tool if you want to give a try https://github.com/darul75/git_dash – darul75 Sep 26 '22 at 18:46
82

I'm doing a git repository statistics generator in ruby, it's called git_stats.

You can find examples generated for some repositories on project page.

Here is a list of what it can do:

  • General statistics
    • Total files (text and binary)
    • Total lines (added and deleted)
    • Total commits
    • Authors
  • Activity (total and per author)
    • Commits by date
    • Commits by hour of day
    • Commits by day of week
    • Commits by hour of week
    • Commits by month of year
    • Commits by year
    • Commits by year and month
  • Authors
    • Commits by author
    • Lines added by author
    • Lines deleted by author
    • Lines changed by author
  • Files and lines
    • By date
    • By extension

If you have any idea what to add or improve please let me know, I would appreciate any feedback.

tomgi
  • 1,422
  • 11
  • 20
48

I tried http://gitstats.sourceforge.net/, starts are very interesting.

Once git clone git://repo.or.cz/gitstats.git is done, go to that folder and say gitstats <git repo location> <report output folder> (create a new folder for report as this generates lots of files)

Here is a quick list of stats from this:

  • activity
    • hour of the day
    • day of week
  • authors
    • List of Authors
    • Author of Month
    • Author of Year
  • files
    • File count by date
    • Extensions
  • lines
    • Lines of Code
  • tags
Jeevan Pingali
  • 1,072
  • 1
  • 9
  • 11
  • 4
    it needs GnuPlot. To install Gnuplot, on Mac grab the dmg from here http://www.miscdebris.net/blog/2009/09/16/install-gnuplot-on-mac-os-x/ the apply this fix to the gnuplot bin, http://www.leancrew.com/all-this/2012/02/fixing-gnuplot-on-os-x-10-7-3/ – loretoparisi Aug 06 '12 at 22:49
  • @Loretoparisi, the first link doesnt work anymore, I have created a tutorial on how to use Gitstats on Mac OSX 10.8.2 here: http://www.softwarepassion.com/quick-peek-into-your-git-repo-with-gitstats/ – Kris Oct 10 '12 at 06:56
  • In ubuntu, sudo apt-get install gnuplot – petertc Aug 11 '14 at 05:23
  • 1
    Hints for getting it running on Windows: https://stackoverflow.com/a/29384484/24267 Unfortunately, I didn't find gitstats too useful - I'd like to see better breakdown of stats for each author. – mhenry1384 May 30 '17 at 19:02
  • For Windows users: https://www.codeproject.com/Tips/830613/Set-and-run-gitstats-on-your-windows-machine – Dani Oct 27 '17 at 19:20
  • is there a 2021 answer to this question? i'm worried that `gitstats` is out of date and not tracking code in newer languages such as `typescript` / `.ts` files. – fIwJlxSzApHEZIl Nov 08 '21 at 17:28
19

git-bars can show you "commits per day/week/year/etc".

You can install it with pip install git-bars (cf. https://github.com/knadh/git-bars)

The output looks like this:

$ git-bars -p month
370 commits over 19 month(s)
2019-10  7    ▀▀▀▀▀▀
2019-09  36   ▀▀▀▀▀▀▀▀▀▀▀▀▀▀▀▀▀▀▀▀▀▀▀▀▀▀▀▀▀▀▀
2019-08  7    ▀▀▀▀▀▀
2019-07  10   ▀▀▀▀▀▀▀▀
2019-05  4    ▀▀▀
2019-04  2    ▀
2019-03  28   ▀▀▀▀▀▀▀▀▀▀▀▀▀▀▀▀▀▀▀▀▀▀▀▀
2019-02  32   ▀▀▀▀▀▀▀▀▀▀▀▀▀▀▀▀▀▀▀▀▀▀▀▀▀▀▀▀
2019-01  16   ▀▀▀▀▀▀▀▀▀▀▀▀▀▀
2018-12  41   ▀▀▀▀▀▀▀▀▀▀▀▀▀▀▀▀▀▀▀▀▀▀▀▀▀▀▀▀▀▀▀▀▀▀▀
2018-11  52   ▀▀▀▀▀▀▀▀▀▀▀▀▀▀▀▀▀▀▀▀▀▀▀▀▀▀▀▀▀▀▀▀▀▀▀▀▀▀▀▀▀▀▀▀▀
2018-10  57   ▀▀▀▀▀▀▀▀▀▀▀▀▀▀▀▀▀▀▀▀▀▀▀▀▀▀▀▀▀▀▀▀▀▀▀▀▀▀▀▀▀▀▀▀▀▀▀▀▀▀
2018-09  37   ▀▀▀▀▀▀▀▀▀▀▀▀▀▀▀▀▀▀▀▀▀▀▀▀▀▀▀▀▀▀▀▀
2018-08  17   ▀▀▀▀▀▀▀▀▀▀▀▀▀▀
2018-07  1    
2018-04  7    ▀▀▀▀▀▀
2018-03  12   ▀▀▀▀▀▀▀▀▀▀
2018-02  2    ▀
2016-01  2    ▀
white_gecko
  • 4,808
  • 4
  • 55
  • 76
17

A quick google search lead me to: http://gitstats.sourceforge.net/

Have you tried this project? I'm sure there are similar projects.

dlamotte
  • 6,145
  • 4
  • 31
  • 40
  • 10
    Quick note for anyone who finds this via Google: gitstats is *not* the same thing as gitstat above. Zomg gitstats is much better, insomuchas it has no dependency hell. It's self contained and just works. – Jay Paroline Aug 13 '10 at 11:37
  • 1
    Except gnuplot-py and company seems to wants to drag in 40MB of deps on Fedora on my webserver :( – Aiden Bell Jun 06 '11 at 10:46
13

repostat is an enhanced fork of gitstats tool.

I'm not sure if it's in any way related to the project with the same name on pypi, so your best bet is to download the latest release from GitHub and install it in your Python environment.

As of November 2019, I was able to use v1.2.0 under Windows 7, after making gnuplot available in PATH.


usage: repostat [-h] [-v] [-c CONFIG_FILE] [--no-browser] [--copy-assets]
                git_repo output_path

Git repository desktop analyzer. Analyze and generate git statistics in HTML
format

positional arguments:
git_repo              Path to git repository
output_path           Path to an output directory

optional arguments:
-h, --help            show this help message and exit
-v, --version         show program's version number and exit
-c CONFIG_FILE, --config-file CONFIG_FILE
                        Configuration file path
--no-browser          Do not open report in browser
--copy-assets         Copy assets (images, css, etc.) into report folder
                        (report becomes relocatable)
alexandrul
  • 12,856
  • 13
  • 72
  • 99
  • 2
    This worked great for me too in November 2020, version 2.2.0, on Windows 10 with Python 3.8 (3.9 is failing at the moment). – AsGoodAsItGets Nov 19 '20 at 12:31
10

Just want to add gitqlite into the mix of answers here, which is a command-line tool that enables execution of SQL queries on git data, such as SELECT * FROM commits WHERE author_name = 'foo' etc.

Full disclosure, I'm a creator/maintainer of the project!

Patrick DeVivo
  • 755
  • 1
  • 9
  • 13
6

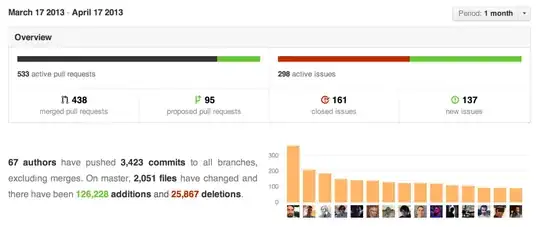
If your project is on GitHub, you now (April 2013) have Pulse (see "Get up to speed with Pulse"):

It is more limited, and won't display all the stats you might need, but is readily available for any GitHub project.

Pulse is a great way to discover recent activity on projects.
Pulse will show you who has been actively committing and what has changed in a project's default branch:

Pulse

You can find the link to the left of the nav bar.

Link

Note that there isn't (yet) an API to extract that information.

VonC
  • 1,262,500
  • 529
  • 4,410
  • 5,250
4

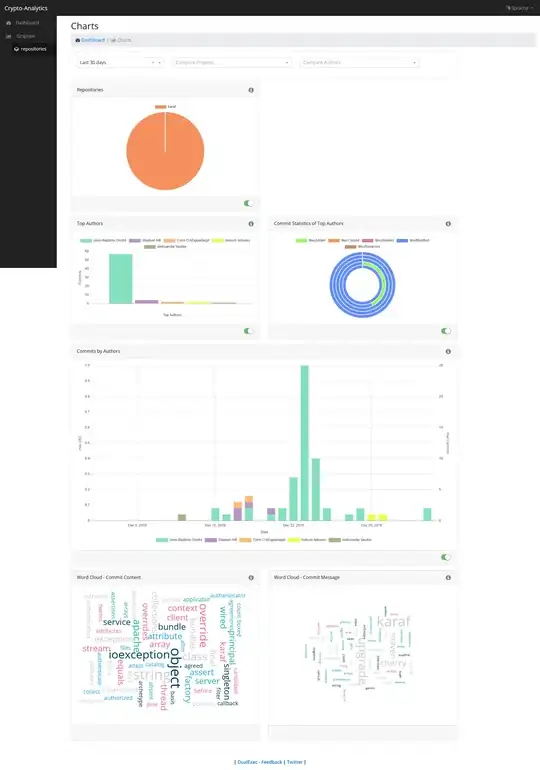
Just yesterday I've added my git-analytics docker-compose file, which builds up several containers to start analyzing multiple git repositories against each other.

It is able to show you commit statistics over time about the author and also several diff statistics.

You can use the provided angular client and also kibana to visualize the statistics.

https://github.com/alexejsailer/git-analytics-docker

It will be improved over time.

Angular Client Screenshot

Angular Client Screenshot

Kibana Client Screenshot

Kibana Client Screenshot]

koppor
  • 19,079
  • 15
  • 119
  • 161
4

And if you prefer hosted solution, you should check out Open Hub (formerly Ohloh.net). It is nice, but don't expect large statistics.

James Skemp
  • 8,018
  • 9
  • 64
  • 107
lzap
  • 16,417
  • 12
  • 71
  • 108
  • If you are ok with a bit clumsy interface and updates on a ~24h basis, ohlohis good choice, otherwise I'd go for DIY approach. – drahnr Apr 24 '12 at 09:58
  • 2
    ohloh is cool, but it only works on public repos. Also, it works with lots of VCSs, not just git. – naught101 Jun 15 '12 at 01:53
  • @naught101 You might try [gitential.com](https://gitential.com) as an alternative. It's in beta, but measures and visualizes coding hours, productivity for projects, teams, repos and individual developers. – kszucs Oct 03 '17 at 12:01