4

Hi
Is there a program to show changes amount graph of a git repository? Specifically a graph that shows these varibales:

  • number of total lines in the course of time (one point for every commit)
  • speed of adding lines (one point between every two commits)
  • speed of removing/modifying lines (one point between every two commits)

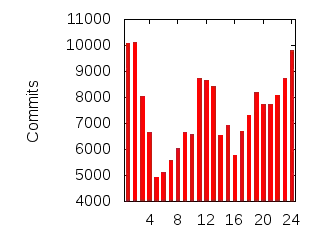
Something like this graph for Linux kernel

I wish there was a graphical tool. Or a tool that gives image as output (bitmap or vector). Or at least there was an easy way to get data for that graphs to use in a spreadsheet program like OpenOfficeCalc or Exel.

saeedgnu
  • 4,110
  • 2
  • 31
  • 48
  • 1
    You could get this data with `git diff --stat commit1 commit2`. You will probably need a script to gather the numbers there for a predefined set of commits (or tags) and extract the numbers... – FelipeFG Apr 03 '11 at 14:46
  • http://stackoverflow.com/questions/1828874/generating-statistics-from-git-repository – Quang Van Feb 11 '12 at 06:51

1 Answers1

5

Not that I know of:

The only graphical stats generator for Git is gitstats, which produces graphs like those for Linux.

commit per hours

Worth checking out: pepper

Pepper is a flexible command-line tool for retrieving statistics and generating reports from source code repositories.
It ships with several graphical and textual reports, and is easily extendable using the Lua scripting language. pepper includes support for multiple version control systems, including Git and Subversion.

They have a neat gallery.


Update April 2013: for GitHub projects, you also have now Pulse (see "Get up to speed with Pulse")

Pulse is a great way to discover recent activity on projects.
Maybe you haven't checked on your favorite repository in a while or you just discovered a project that looks interesting to you. Pulse will show you who has been actively committing and what has changed in a project's default branch:

Pulse

You can find the link to the left of the nav bar.

Link

VonC
  • 1,262,500
  • 529
  • 4,410
  • 5,250