I have data that looks like this
    df <- data.frame(c("Cell1","Cell2","NK-Cell"),c("K","L","S","L","K","S","S","L","K"),abs(log2(abs(rnorm(180)))))
colnames(df) <- c("ctype","tissue","exp")
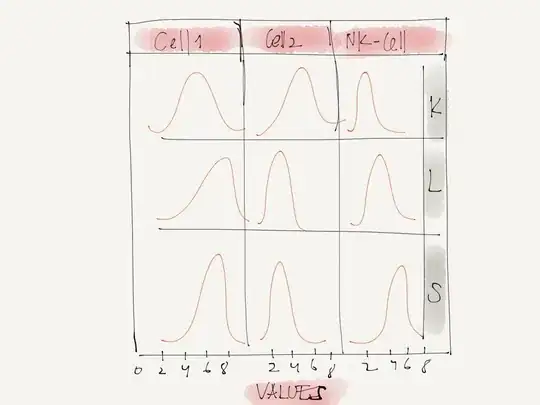
I'm trying to create a plot that looks like this.
I have data that looks like this
df <- data.frame(c("Cell1","Cell2","NK-Cell"),c("K","L","S","L","K","S","S","L","K"),abs(log2(abs(rnorm(180)))))
colnames(df) <- c("ctype","tissue","exp")
I'm trying to create a plot that looks like this.
General idea in this situation would be to use faceting to get this kind of plot.
ggplot(df,aes(exp))+geom_density()+facet_grid(tissue~ctype)
There are two empty plots because there are no Cell2 values for the tissue S and no NK-Cell values for tissue L.