The color index for the impulses is used to select a line style, while for the labels the line type is used. This behaviour is still present in the current development version. According to the documentation, the behaviour for the labels is correct. help linecolor variable says: "lc variable tells the program to use the value read from one column of the input data as a linetype index... Text colors can be set similarly using tc variable". Bug, feature or wrong documentation?
As a workaround you can use lc palette and an appropriately defined palette:
set style line 1 linetype 1 linewidth 2 pointtype 3 linecolor rgb "aquamarine"
set style line 2 linetype 1 linewidth 2 pointtype 3 linecolor rgb "blue"
set style line 3 linetype 1 linewidth 2 pointtype 3 linecolor rgb "coral"

set palette defined (1 "aquamarine", 2 "blue", 3 "coral")
unset colorbox
set xrange [0:3]
set yrange [0:3]

# function to get style index for coloring:
getCol(x) = (x==0)?1:((x==1)?2:3)

unset key
plot \
  '-' using ($1+0.5):($2+0.5):(getCol($2)) with impulses lc variable, \
  '' using ($1+0.5):($2+0.5):(stringcolumn(2)):(getCol($2)) with labels \
    tc palette point ls 1 pt 7 lc palette offset 1,1
0 0
1 1
1.5 1
2 2
e
0 0
1 1
1.5 1
2 2
e
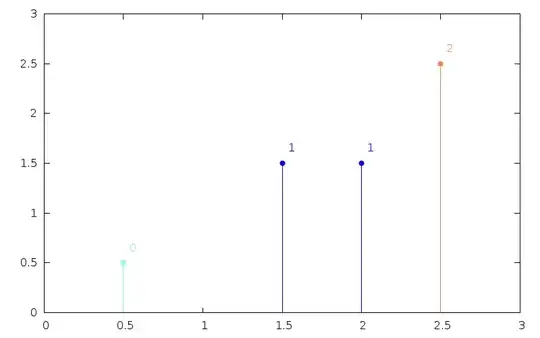
This gives the result:
I hope that workaround works also in your real case. If for some reason you can't redefine the palette, you can use lc rgb variable, in which case the last column must be an integer representation of the respective rgb color:
set style line 1 linetype 1 linewidth 2 pointtype 3 linecolor rgb "aquamarine"
set style line 2 linetype 1 linewidth 2 pointtype 3 linecolor rgb "blue"
set style line 3 linetype 1 linewidth 2 pointtype 3 linecolor rgb "coral"

set xrange [0:3]
set yrange [0:3]

rgb(r,g,b) = 65536 * int(r) + 256 * int(g) + int(b)
rgb1 = rgb(2, 215, 245) # something like aquamarine
rgb2 = rgb(0, 0, 255)
rgb3 = rgb(245,140,2)
getCol(x) = (x==0)?rgb1:((x==1)?rgb2:rgb3)

unset key
plot \
  '-' using ($1+0.5):($2+0.5):(getCol($2)) with impulses \
    lc rgb variable, \
  '' using ($1+0.5):($2+0.5):(stringcolumn(2)):(getCol($2)) with labels \
    tc rgb variable point ls 1 pt 7 lc rgb variable offset 1,1
0 0
1 1
1.5 1
2 2
e
0 0
1 1
1.5 1
2 2
e
You may only need to tweek the rgb values.
However, I will bring up this discussion on the gnuplot mailinglist to see if this is really a bug, or whatever.