I am trying to make a scatter plot in R using these points:
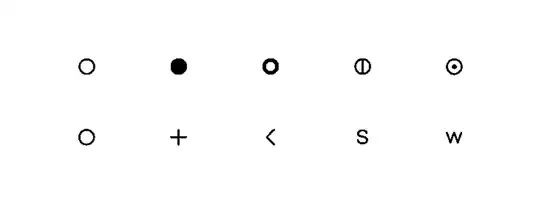
(as far as I can trace, W. Cleveland suggested using these for sparse and dense, respectively, scatter plots -- I now call them "Cleveland points".)
The bottom row should be straightforward, and the top row could be achieved by doing some smart overplotting (i.e. plotting two symbols on top of each other). But this will not suffice when plotting the legend.
As a solution I was therefore imagining getting a font that contains these 10 symbols and instruct R to use this font when plotting the points + legend.
(And now it occurs to me, that I might just use text with the custom font to plot the points. But this does not solve the legend issue.)
I have also considered using ggplot2, but this would perhaps easiest be implemented via a scale?
Question: Any suggestions on how to use these symbols (preferable the top row), that can also be used in the legend?