This is a plot from a 2009 paper (PDF).
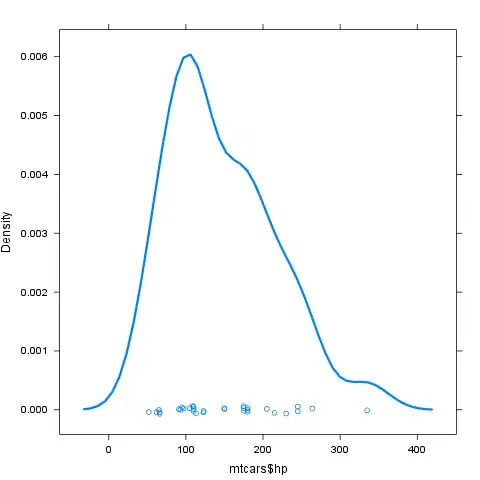
- What software was used to draw this?
- How can I achieve the same type of drawing the markers surrounded by white space with matplotlib?
This is a plot from a 2009 paper (PDF).
You could probably achieve this type of plot with several different plotting packages. To get something similar in matplotlib, try setting up the markers as follows:
import numpy as np
import matplotlib.pyplot as plt
# random data to stand in
x1 = 0.8+0.1*np.random.rand(25)
x2 = 0.3+0.2*np.random.rand(25)
# customise the marker properties
plt.plot(x1, color='g', marker='s', mec='w', mfc='g', mew='3', ms=8)
plt.plot(x2, color='b', marker='s', mec='w', mfc='b', mew='3', ms=8)
plt.show()
See the plot and line2D docs for more information on the properties that you can modify.