0

So I'm using matlibplot with Python 2.7.5 :: Anaconda 1.7.0 (64-bit) The only uncommented lines in my matlibplot.rc file are:

figure.figsize   : 10, 5    # figure size in inches
figure.dpi       : 80      # figure dots per inch  
figure.facecolor : 1   # figure facecolor; 0.75 is scalar gray  
savefig.dpi         : 80      # figure dots per inch  
savefig.facecolor   : white    # figure facecolor when saving  

If I call:

plt.savefig(name, bbox_inches=0)  
plt.show()  

everything works fine
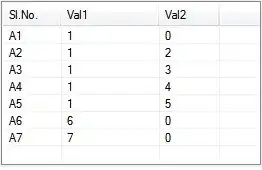
Output from show:

Output from savefig:

However, if I simply comment out the show line the same file looks like this:

What's going on??? How can I fix this?

arghdos
  • 329
  • 2
  • 14
  • Please see http://stackoverflow.com/questions/14254379/how-can-i-attach-a-pyplot-function-to-a-figure-instance/14261698#14261698 for an explanation of the state machine vs OO interfaces to mpl. – tacaswell Oct 23 '13 at 03:17
  • and can you post enough code to reproduce this? The accepted answer may work, but it does not really explain what is going on. – tacaswell Oct 23 '13 at 03:19

1 Answers1

0

It's likely that previous figures are being overlaid on the current figure, especially if you have hold on.

Two simple ways to fix this:

Toggle hold before plotting to clear the graph:

pylab.hold(False) # clears graph
pylab.hold(True) # restores to state you want

Or explicitly clear the graph after saving:

pylab.save(...)
pylab.close()

The reason you don't see this behaviour with show is that there is an implicit close called when you close the figure which appears.

sapi
  • 9,944
  • 8
  • 41
  • 71
  • Yup that was it. Thanks – arghdos Oct 23 '13 at 01:24
  • I don't understand what you mean when you say `pylab.hold(False)` clears the figure. That should just toggles a bool in `axes` object. – tacaswell Oct 23 '13 at 03:22
  • Further, you don't call the `close` until _after_ the file as already saved to disk, so I do not understand how that could affect the saved graph. – tacaswell Oct 23 '13 at 03:23
  • @tcaswell - if there is existing data in the figure (due to a previous hold), `hold(False)` will clear it. Similarly with closing the figure. The issue was that previous runs of the function had left data on the current figure, which the next `savefig` call then saw. As you can see, this solved arghdos' problem :) – sapi Oct 23 '13 at 11:11
  • no, `hold()` toggles a bool which controls if `clf()` is called the text time you call a plotting function, turning in on and off has no effect. – tacaswell Oct 23 '13 at 16:59