i had done a dcc garch fitting which give me a dcc.fit.ret.fin object
now plotting is done by
plot(dcc.fit.ret.fin)

Make a plot selection (or 0 to exit):
1:   Conditional Mean (vs Realized Returns)
2:   Conditional Sigma (vs Realized Absolute Returns)
3:   Conditional Covariance
4:   Conditional Correlation
5:   EW Portfolio Plot with conditional density VaR limits

Selection: 3
gives this plot
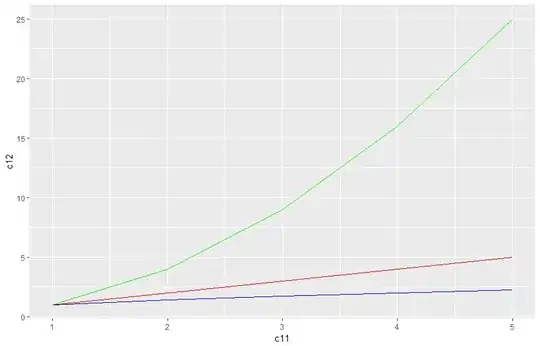
my dcc model is a multivariate model series and this plot only deal with series 1 and series 2 of my model, how am i supposed to get a plot which show my series 'i' with series 'j'?