Is there a command to easily add a grid onto an R plot?
Asked
Active
Viewed 6.4k times
41
-
1Maybe consider changing accepted answer to [this one](http://stackoverflow.com/a/42729195/680068) ? – zx8754 Mar 29 '17 at 07:49
-
Or better yet, use ggplot2 for plotting. It has lots of really awesome defaults (including grids, which can be customized) and has a very natural and thoughtful grammer for assigning aesthetic attributes to aspects of your plots based on the data you are working with. It's th – metasoarous Apr 13 '12 at 20:53
5 Answers
60
The grid command seems to draw grid lines where-ever it feels like. I usually use abline to put lines exactly where I want them. For example,
abline(v=(seq(0,100,25)), col="lightgray", lty="dotted")
abline(h=(seq(0,100,25)), col="lightgray", lty="dotted")
Good luck!
cbare
- 12,060
- 8
- 56
- 63
-
8That's fantastic. `grid()` desperately needs arguments for where to place the first grid-line on each axis. This is a great substitute. – Hank Jul 18 '11 at 12:43
47
See help(grid) which works with standard graphics -- short example:
R> set.seed(42)
R> plot(cumsum(rnorm(100)), type='l')
R> grid()
The ggplot2 package defaults to showing grids due to its 'Grammar of Graphics' philosophy. And lattice has a function panel.grid() you can use in custom panel functions.
By the way, there are search functions for help as e.g. help.search("something") and there is an entire package called sos to make R web searches more fruitful.
Dirk Eddelbuettel
- 360,940
- 56
- 644
- 725
-
In cases when we want grid in the background, see [below answer](http://stackoverflow.com/a/42729195/680068). – zx8754 Mar 29 '17 at 07:38
19
If you are not using a custom tick interval, you can control the grid and axes parameters directly from the plot() command:
plot(cumsum(rnorm(100)), type='l', panel.first=grid())
The plot.default() documentation provides more information about these parameters.
-
1Careful, it does not work if you are using the formula method `plot(x~y, panel.first= grid())` – rvezy Oct 05 '17 at 17:58
-
1`panel.first` argument is lazy-evaluated, it messes up the grid often. Pity. – ivan866 Feb 14 '20 at 12:35
-
This answer is incorrect because it will add grid lines in the tick marks of the default axis. The answer by @cbare should be the one accepted. – JASC Jul 16 '21 at 23:59
5
I agree with cbare.
Use abline to draw lines only where you really need.
Example from my last code:
abline(v=c(39448, 39814), col="grey40")
abline(h=c(-0.6, -0.4, -0.2, 0.2,0.4,0.6), col="grey10", lty="dotted")
remember that:
v is for vertical lines.
h for horizontal.
exploit the commands
lty for dotted line
color for light coloured line
in order to obtain "no heavy grid".
FraNut
- 676
- 1
- 11
- 22
2
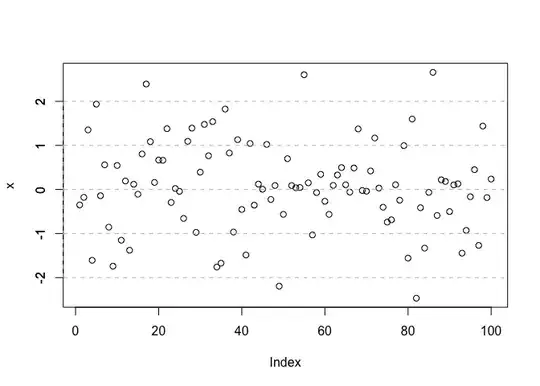
Another option is using the axis function for vertical and horizontal grid lines:
x <- rnorm(100)
plot(x)
# Vertical grid
axis(1, tck = 1, lty = 2, col = "gray")
# Horizontal grid
axis(2, tck = 1, lty = 2, col = "gray")

# Only vertical grid
plot(x)
# Vertical grid
axis(1, tck = 1, lty = 2, col = "gray")
# Only horizontal grid
plot(x)
# Horizontal grid
axis(2, tck = 1, lty = 2, col = "gray")
Created on 2022-08-20 with reprex v2.0.2
You can specify the position of the grid lines using the at argument.
Quinten
- 35,235
- 5
- 20
- 53