1

I am on OS X and using Encopy(by Enthought inc.) to write my python programs. The following code which I took it from here only generates one point and then it terminates:

from pylab import *
import time
t = linspace(0.0, pi, 100)
x = cos(t)
y = sin(t)

ion()  # turn on interactive mode
figure(0)
subplot(111, autoscale_on=False, xlim=(-1.2, 1.2), ylim=(-.2, 1.2))

point = plot([x[0]], [y[0]], marker='o', mfc='r', ms=3)

for j in arange(len(t)):
    # reset x/y-data of point
    setp(point[0], data=(x[j], y[j]))
    time.sleep(0.05)
    draw() # redraw current figure

ioff() # turn off interactive mode
show()

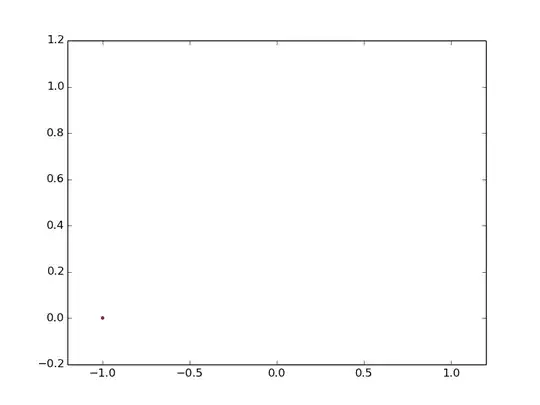
Any Ideas what might be the problem? And below is the photo of the result I get.enter image description here

Community
  • 1
  • 1
Cupitor
  • 11,007
  • 19
  • 65
  • 91

1 Answers1

2

It is only plotting one point because you are only telling it to plot one point. If you want to draw the line up to j use the following:

from pylab import *

t = linspace(0.0, pi, 100)
x = cos(t)
y = sin(t)
figure(0)
subplot(111, autoscale_on=False, xlim=(-1.2, 1.2), ylim=(-.2, 1.2))

point,  = plot([x[0]], [y[0]], marker='o', mfc='r', ms=3)

for j in arange(len(t)):
    # reset x/y-data of point
    point.set_data(x[:j], y[:j])
    plt.pause(0.05)
    plt.draw() # redraw current figure
tacaswell
  • 84,579
  • 22
  • 210
  • 199
  • Thanks a lot but what did you change that made the difference? I didn't quite get it! – Cupitor Oct 28 '13 at 18:25
  • @Naji I suggest you walk through the code by hand and look up what each function does. – tacaswell Oct 28 '13 at 18:27
  • What I can see is that you changed the point.set_data arguments. Well according to matplotlib's tutorial, setp is used to set the lines properties and I don't see anything wrong with that code. Plus there also another interesting thing with your code that you don't even change the interactive mode. How come?? – Cupitor Oct 28 '13 at 18:31