I use two variables from a dataset: I got the graph for one of them:
barchart(data_derm$PP_SD_ARBVLZ=="1")
I want to put the graph for this variable data_derm$PP_SD_ARBTLZ=="1" next to the other graph to one graph
thanks a lot for any help!
I use two variables from a dataset: I got the graph for one of them:
barchart(data_derm$PP_SD_ARBVLZ=="1")
I want to put the graph for this variable data_derm$PP_SD_ARBTLZ=="1" next to the other graph to one graph
thanks a lot for any help!
Without a reproducible example, this question will be difficult to answer definitively. One possibility is to use something like ?layout:
layout(matrix(1:2, nrow=1))
barchart(data_derm$PP_SD_ARBVLZ=="1")
barchart(data_derm$PP_SD_ARBTLZ=="1")
See the Quick-R website for more.
So you want two graphs in one figure if I am understanding you correctly.
If you want the commands from the base package. You can use:
> data(mtcars)
# par(mfrow=c(row, col)) and "row" is the number of plots you put in a row and same for "col"
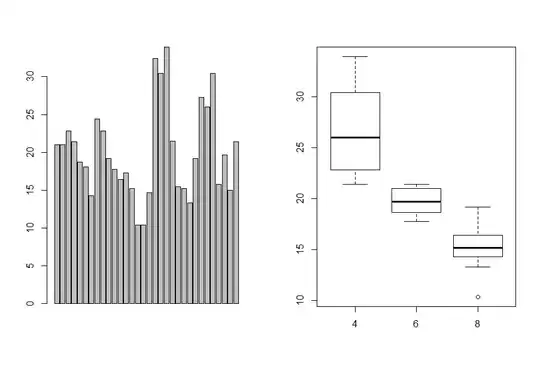
> par(mfrow=c(1,2))
> barplot(mtcars$mpg)
> boxplot(mtcars$mpg ~ as.factor(mtcars$cyl))
You can use other functions if you don't mind using with GGPLOT2.. etc.