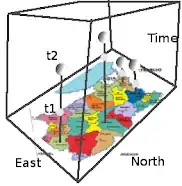
I would like to plot 3d spheres over a map in specific points. Radious of the spheres measures my variable in one time.
I have x,y for east and north axis in UTM projection. In z is the time and I have 2 observations in 4 positions of my map.
I want to present how changed my variable in the space and time.
The image I have in Shapefile or Geotiff format.
I saw another 3d plot similar to this one but not with maps. Example 1 Example 2
My plot should be like this one:
