How can I add the sample ID (row number) as labels to each point in this LDA plot?
library(MASS)
ldaobject <- lda(Species~., data=iris)
plot(ldaobject, panel = function(x, y, ...) points(x, y, ...),
     col = as.integer(iris$Species), pch = 20)
How can I add the sample ID (row number) as labels to each point in this LDA plot?
library(MASS)
ldaobject <- lda(Species~., data=iris)
plot(ldaobject, panel = function(x, y, ...) points(x, y, ...),
col = as.integer(iris$Species), pch = 20)
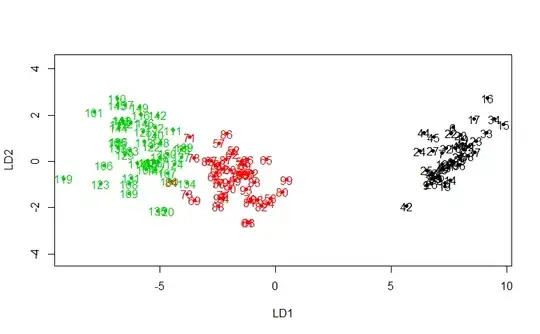
You can use text in the panel function:
library(MASS)
ldaobject <- lda(Species~., data=iris)
plot(ldaobject,
     panel = function(x, y, ...) {
       points(x, y, ...)
       text(x,y,labels=seq_along(x),...) ## You change labels here
      }
      ,
     col = as.integer(iris$Species), pch = 20)