With Octave I am able to plot arrays to the terminal, for example, plotting an array with values for the function x^2 gives this output in my terminal:
   10000 ++---------+-----------+----------+-----------+---------++
         ++         +           +          +           +         ++
         |+         :           :          :           :         +|
         |++        :           :          :           :        ++|
         | +        :           :          :           :        + |
         | ++       :           :          :           :       ++ |
    8000 ++.+..................................................+.++
         |  ++      :           :          :           :      ++  |
         |   ++     :           :          :           :     ++   |
         |    +     :           :          :           :     +    |
         |    ++    :           :          :           :    ++    |
         |     +    :           :          :           :    +     |
    6000 ++....++..........................................++....++
         |      ++  :           :          :           :  ++      |
         |       +  :           :          :           :  +       |
         |       ++ :           :          :           : ++       |
         |        ++:           :          :           :++        |
    4000 ++........++..................................++........++
         |          +           :          :           +          |
         |          ++          :          :          ++          |
         |          :++         :          :         ++:          |
         |          : ++        :          :        ++ :          |
         |          :  ++       :          :       ++  :          |
    2000 ++.............++........................++.............++
         |          :    ++     :          :     ++    :          |
         |          :     +++   :          :   +++     :          |
         |          :       ++  :          :  ++       :          |
         |          :        +++:          :+++        :          |
         +          +          ++++      ++++          +          +
       0 ++---------+-----------+----------+-----------+---------++
         0        20000       40000      60000       80000     100000
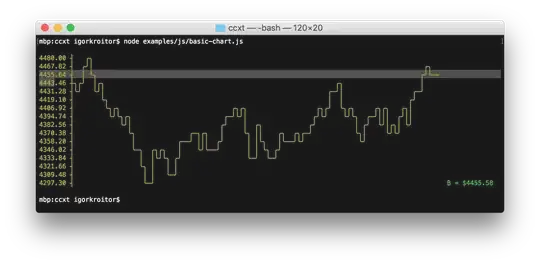
Is there some way I can do something similar in Python, specifically with matplotlib? bashplotlib seems to offer some of this functionality but appears to be quite basic compared to Octave's offering.


