I'm having some problems with the xticks of the graph here:
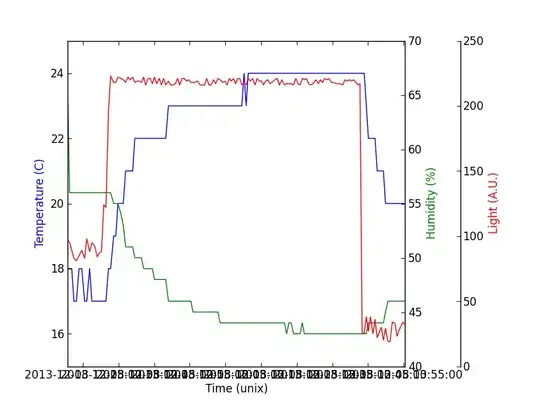
Can anyone help?
I tried what they did here: Date ticks and rotation in matplotlib but to no avail.
import numpy as np
from mpl_toolkits.axes_grid1 import host_subplot
import mpl_toolkits.axisartist as AA
import matplotlib.pyplot as plt
import datetime as DT
import matplotlib.dates as mdates
import matplotlib.ticker as ticker

#import data
i, time, temp, hum, light_lv, light_v = np.loadtxt('DHT11.csv', delimiter = ',', skiprows = 1,
                     usecols = (0,2,3,4,5,6), unpack = 1)

#id, unixtime, temp, humidity, lightlevel, lightvolt


time = [DT.datetime.fromtimestamp(t) for t in time]
light_lv =  250 - light_lv

xfmt = mdates.DateFormatter('%Y-%m-%d %H:%M:%S')

if 1:


    host = host_subplot(111, axes_class=AA.Axes)
    host.xaxis.set_major_formatter(xfmt)

    plt.subplots_adjust(right=0.75)

    par1 = host.twinx()
    par2 = host.twinx()

    offset = 60
    new_fixed_axis = par2.get_grid_helper().new_fixed_axis
    par2.axis["right"] = new_fixed_axis(loc="right",
                                        axes=par2,
                                        offset=(offset, 0))

    par2.axis["right"].toggle(all=True)


    #host.set_xlim(0, 25)
    host.set_ylim(15, 25)

    host.set_xlabel("Time (unix)")
    host.set_ylabel("Temperature (C)")
    par1.set_ylabel("Humidity (%)")
    par2.set_ylabel("Light (A.U.)")

    p1, = host.plot(time, temp)
    p2, = par1.plot(time, hum)
    p3, = par2.plot(time, light_lv)

    #par1.set_ylim(0, 4)
    #par2.set_ylim(1, 65)

    host.legend()

    host.axis["left"].label.set_color(p1.get_color())
    par1.axis["right"].label.set_color(p2.get_color())
    par2.axis["right"].label.set_color(p3.get_color())

    plt.draw()
    plt.show()

    #plt.savefig("Test")