I am trying to left-align two plot areas in two separate charts. Both charts have a single x-axis and two y-axes. I have tried using the following code (which I obtained via the Macro Recorder), but the charts are not aligned. I have also included a picture of the problem. What am I missing?
EDIT: I should add that Chart2 has the same width but a different height than Chart1 (as seen in the code). If I set the dimensions for the charts to be the same, they align perfectly. I thought that the Left and Top alignment would align the plot areas vertically since they both have the same width (1140)).
VBA:
    ActiveSheet.ChartObjects("Chart1").Activate
    ActiveSheet.Shapes("Chart1").Width = 1200
    ActiveChart.PlotArea.Select
    Selection.Left = 10
    Selection.Top = 8
    ActiveChart.PlotArea.Select
    Selection.Width = 1140
    Selection.Height = 310

    ActiveSheet.ChartObjects("Chart2").Activate
    ActiveSheet.Shapes("Chart2").Width = 1200
    ActiveChart.PlotArea.Select
    Selection.Left = 10
    Selection.Top = 8
    ActiveChart.PlotArea.Select
    Selection.Width = 1140
    Selection.Height = 110
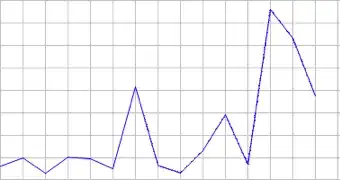
The red dotted lines show the misalignment: