i am creating line chart using JFreeChart.
Line chart draw properly but i want to start at point 0. how can i do that?
public void lineChart()
{
CategoryDataset ds=createDataset2();
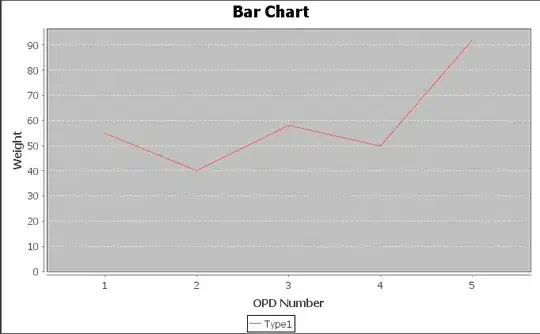
chart2=ChartFactory.createLineChart("Bar Chart", "OPD Number", "Weight", ds,PlotOrientation.VERTICAL,true,true,false);
ChartPanel cp = new ChartPanel(chart2);
jp.add(cp); //jp is JPanel
}
public CategoryDataset createDataset2()
{
final DefaultCategoryDataset dataset= new DefaultCategoryDataset();
final String series1 = "Type1";
OPDDetailBean ob=new OPDDetailBean();
ArrayList<OPDDetailBean> aob=new ArrayList<OPDDetailBean>();
aob=ob.searchOPDDetails("5");
for(int i=0;i<aob.size();i++)
{
dataset.addValue(Integer.parseInt(aob.get(i).getWeight()), series1, ""+(i+1));
}
return dataset;
}
which give output..
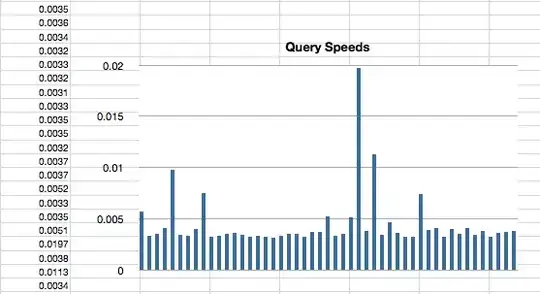
And i want output like.