5

I am new to R and ggplot2 and I was wondering how can I produce a timeline plotting points at a given time using R? I am also having some trouble with the dates I have. (I’m not sure if I should post this as two questions, but here goes).

I have a data frame with the year and month as characters in the format YYYYMM, names of two people and the event that took place.

Like this:

> data

YearMonth   Person1   Person2    Event
200606       Alice      Bob      event1
200606       Bob        Alice    event2
200608       Alice      Bob      event3
200701       Alice      Bob      event3
200703       Bob        Alice    event2
200605       Alice      Bob      event4

The dates were originally integers, which I converted to characters using as.character(). I am trying to convert it to a formatted date. I used as.Date() and tried different ways to format the date. The closest I came was with data$YearMonth <- as.Date(data$YearMonth,"%Y"), but this got me ‘2006-12-20’ and ‘2007-12-20’ for all the 2006xx and 2007xx rows, respectively. Is there any way to do this so that I get something like ‘YYYY-MM’ or ‘YYYY/MM’?

I also tried data$YearMonth <- strptime(data$YarMonth, "%Y%m"), but that gave me <NA> values.

But my main problem is the timeline.

The following image is the sort of format I want:

http://www.vertex42.com/ExcelArticles/Images/timeline/Timeline-for-Benjamin-Franklin.gif

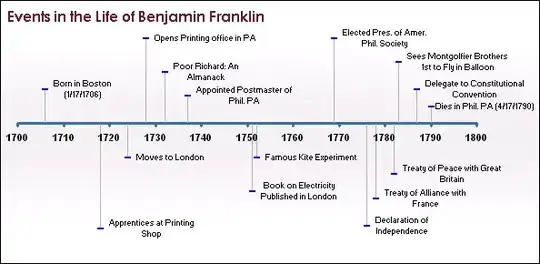
but with the x axis showing the month and year (like 2006-06, 2006-07 … 2007-06), and the lines coming off the axis labelled with the Event, Person1 and Person2.

I have looked at the ‘timeline’ package at ?timeline but the data frame I have doesn’t have data for the time periods (start and end dates). I just have a point in time (YearMonth).

I also tried the example at Draw a chronological timeline with ggplot2 using ggplot2. However I don’t have the dislocations for a y-axis and I wanted the event lines coming off the x axis.

Note: This is a very simplified example as I have about a thousand rows for the time period June 2006 – June 2007. Is it even possible to make the timeline with this much data?

Any help is much appreciated. Thanks for your time!

Community
  • 1
  • 1
o.o
  • 143
  • 1
  • 5
  • 11

3 Answers3

9

Here's another attempt:

df$YM <- as.Date(paste0("01",df$YearMonth), format="%d%Y%m")
rangeYM <- range(df$YM)

plot(NA,ylim=c(-1,1),xlim=rangeYM,ann=FALSE,axes=FALSE)
abline(h=0,lwd=2,col="#5B7FA3")

ypts <- rep_len(c(-1,1), length.out=nrow(df))
txtpts <- rep_len(c(1,3), length.out=nrow(df))
segments(df$YM,0,df$YM,ypts,col="gray80")

axis.Date(
 1,
 at=seq.Date(rangeYM[1],rangeYM[2],by="month"),
 format="%Y-%m",
 cex.axis=0.6,
 pos=0,
 lwd=0,
 lwd.tick=2,
 col="#5B7FA3",
 font=2
)

points(df$YM,y=ypts, pch="-", cex=1.5, col="#5B7FA3")
par(xpd=NA)
text(
  df$YM, y=ypts,
  labels=paste(df$Person1,df$Person2,df$Event,sep="\n"), cex=0.7, pos=txtpts
)
par(xpd=FALSE)

enter image description here

thelatemail
  • 91,185
  • 12
  • 128
  • 188
  • Thank you so much @thelatemail. Aside from a few issues with the amount of data I had, it worked perfectly! :) – o.o Dec 22 '13 at 22:40
  • @thelatemail in `axis.Date` the `pos` positions the date values on horizontal line. Is there any option to do this in ggplot2? There is no option for position in `scale_x_date`. please help – mockash Dec 28 '16 at 05:23
  • Do you know how to make this with more than 2 events per day? I posted a question based off your example here: http://stackoverflow.com/questions/43529103/timeline-graph-with-more-than-2-events-in-one-day?noredirect=1#comment74111385_43529103 – nak5120 Apr 20 '17 at 20:51
  • Error in plot.window(...) : need finite 'xlim' values Calls: Anynumous eval -> plot -> plot.default -> localWindow -> plot.window – Europa May 29 '21 at 10:08
  • @europa - you probably have NAs in your x axis values. Try range(df$YM, na.rm=TRUE). – thelatemail May 29 '21 at 10:27
2

Why not this:


>YearMonth = c(200506,200509) 

>dt = as.POSIXct(strptime(paste0(YearMonth, 15), "%Y%m%d"))
>z = rep(0, length(dt))
>y = rep(c(-1,1), out=length(dt))
>plot(dt,y, axes=FALSE, ylab="", xlim=c(min(dt)-10e6, max(dt)+10e6), ylim=c(-2,2), pch=15, col="darkblue", xlab="Date")
>arrows(x0=dt,y0= z, x1=dt, y1=y, length=0, angle=30, col="blue")
>arrows(min(dt), 0, max(dt), length=0, col="blue")
>text(dt, y*1.5, c("Ben Franklin arose\nfrom the dead", "Atlantis found"), adj=1)
>axis.POSIXct(1, dt, format="%y/%m")
>dt
[1] "2005-06-15 EDT" "2005-09-15 EDT"

enter image description here

alex keil
  • 1,001
  • 7
  • 14
  • Thanks for your reply. That gives me a day as well, not just the year and month. I guess I could just use that, but I'm wondering if it might cause problems when making the timeline. I wanted to see if I could use the dates from my data frame as the dates for the axis. – o.o Dec 20 '13 at 03:13
  • @o.o - all alex has done is choose a middle point for each month/year. Any plot of a month/year combo will have a nominal day associated with it, whether it be the first, last, middle or other day. – thelatemail Dec 20 '13 at 03:24
  • I changed the dates on the axis - they did look like they included a day. The "day" addition is just a trick to get the POSIXct date function to work, which makes plotting easier. You *should* be able to apply my date function directly to a data frame to make your dates work. – alex keil Dec 20 '13 at 03:28
  • Your other option is to convert your dates into decimal dates - that will work better if you don't worry about the months on the plot. – alex keil Dec 20 '13 at 03:30
0

With some slight changes to answer of @thelatemail you can finetune the axis to print indicator for event dates and also manage the overlap of events that occur on same date..or manage the overlap arising due to the amount of data you have in your df..

df$YM <- as.Date(paste0("01",df$YearMonth), format="%d%Y%m")
rangeYM <- range(df$YM)
plot(NA,ylim=c(-1,1),xlim=rangeYM,ann=FALSE,axes=FALSE)
abline(h=0,lwd=2,col="#5B7FA3")
ypts <- rep(c(-1,-0.5,0.5,1), length.out=nrow(df))
txtpts <- rep(c(1,3), length.out=nrow(df))
segments(df$YM,0,df$YM,ypts,col="gray80")
axis.Date( 1,at=seq.Date(rangeYM[1],rangeYM[2],by="days"),
format="%Y-%m",
cex.axis=0.6, pos=0, lwd=0, lwd.tick=2, col="#5B7FA3", font=2)
points(df$YM,y=ypts, pch="-", cex=1.5, col="#5B7FA3")
par(xpd=NA)
text( df$YM, y=ypts,labels=paste(df$Person1,df$Person2,df$Event,sep="\n"),cex=0.7, pos=txtpts)
par(xpd=FALSE)
Vijayan
  • 1
  • 1