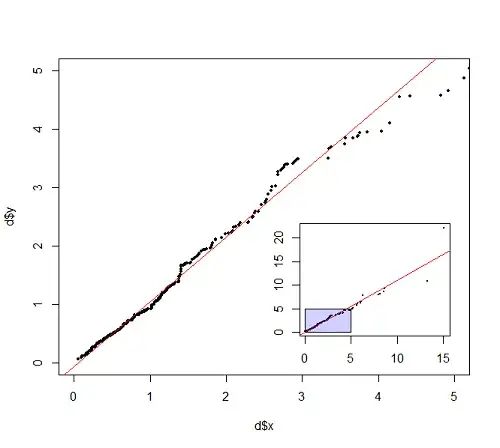
I'm trying to recreate this base-produced plot with ggplot, but I want to use a workflow more elegant than the the one demonstrated here, which relies directly on grid::viewport().
Using ggsubplot, I tried:
require(ggplot2)
require(ggsubplot)
d = data.frame(x = sort(rlnorm(300)), y = sort(rlnorm(300)), grp = 1)
ggplot(d, aes(x, y)) + geom_point() + theme_bw() +
  scale_x_continuous(limits=c(0, 10)) + scale_y_continuous(limits=c(0, 10)) +
  geom_subplot(data=d, aes(x=5, y=1, group = grp, subplot = geom_point(aes(x, y))), width=4, height=4)
which produced the following disappointing result:

Obviously needs some work, but if axes, labels and grid are added to the subplot its not far off. Any idea how to do these? I can't find any examples of this, and ggsubplot defaults to removing these elements. Thanks in advance.