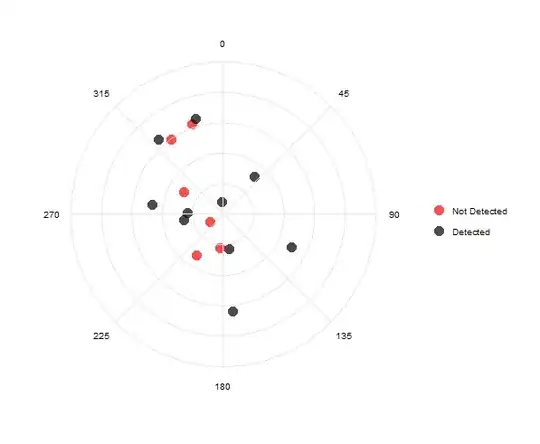
I have a polar plot in ggplot2 that I am getting pretty close in finishing (fairly simple plot). I have been able to get assistance in removing the rectangular boarder but not I need to remove the extra space between the last range contour and the ring around the plot that has the azimuth labels on it. I would like for the bounds of this plot to be at 15,000... not 15,214 (I made that number up). Thanks for any help.
The code to generate the plot is below:
# Load needed Libraries ---------------------------------------------------

library(ggplot2)

# Generate Fake Data ------------------------------------------------------

N    = 25
bng  = runif(N, min =  0, max = 360)
rng  = rlnorm(N, meanlog = 9, sdlog = 1)
det  = runif(N, min = 0, max = 1) >= 0.5

det  = factor(det)

data = data.frame(bng, rng, det)

# Generate the Plot -------------------------------------------------------

plot = ggplot(data) + theme_bw() +
  geom_point(aes(x = bng, y = rng, color = det), size = 5, alpha = 0.7) +
  scale_x_continuous(limits = c(0,360), expand = c(0,0), breaks = seq(0,360-1, by=45)) +
  scale_y_continuous(limits = c(0,15000), breaks = seq(0,15000, by = 3000)) +
  coord_polar(theta = 'x', start = 0, direction = 1) +
  theme(legend.key = element_blank()) +
  theme(panel.border = element_blank(), axis.ticks = element_blank(), axis.text.y = element_blank()) +
  labs(x = '', y = '') +
  scale_color_manual(name = '', values = c('red', 'black'), breaks = c(FALSE, TRUE), labels = c('Not Detected', 'Detected'))
plot