Stackoverflow,
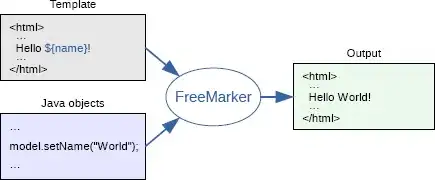
How do I draw a graph like this in R package?

At this graph, left column indicates a variable, and the other right column indicates the other variable.
I tried to use ggplot2 or basic functions but I was not able to find the solution.
I found some solutions from the web, but they are not clear and looks messy.
I want to academic paper quality graphs. Please Help me.
Thanks,