27

I'm trying to set the default color for all geoms in a ggplot to something other than black. Note this is not about setting scale_color...

Simple example:

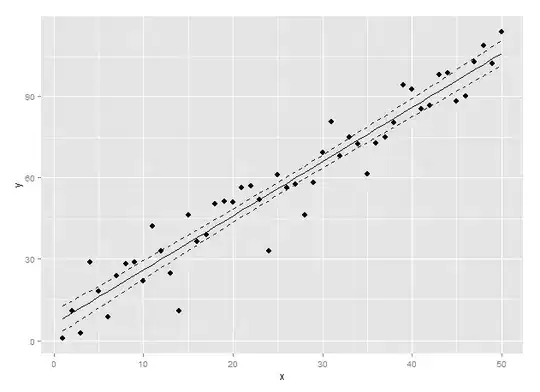
# linear model with confidence bands...
set.seed(1)
df <- data.frame(x=1:50, y=5 + 2*(1:50)+rnorm(50,sd=10))
lm <- lm(y~x,df)
se <- summary(lm)$sigma           # standard error of fit
Z  <- qnorm(0.05/2,lower.tail=F)  # 95% confidence bands
df <- cbind(df,predict(lm,se.fit=T)[c("fit","se.fit")])
# plot the result...
library(ggplot2)
ggplot(df, aes(x=x)) + 
  geom_point(aes(y=y), size=3) +
  geom_line(aes(y=fit)) +
  geom_line(aes(y=fit+Z*se.fit), linetype=2)+
  geom_line(aes(y=fit-Z*se.fit), linetype=2)

Now, suppose I want to make everything red. Leaving aside the advisability of doing that, I would think ggplot(df, aes(x=x), colour="red") would do it. But the colour= parameter seems to be ignored: everything is still black. I can add colour="red" to every geom_ call, but I'm trying to avoid that.

Edit: Using ggplot(df, aes(x=x, color="red")) is not an option because it creates a color scale using the default ggplot palette (evenly spaced around an HSL color circle). With one color, this is #F8766D, which happens to be light red. In addition, this creates a legend which then must be hidden.

jlhoward
  • 58,004
  • 7
  • 97
  • 140
  • Just curiously, why do you not want to use scale_color_? – PirateGrunt Sep 15 '15 at 14:29
  • @PirateGrunt The edit at the end of the question kind of explains it. I would have to create a color scale by setting a color in `aes(...)` in the ggplot call, then use something like `scale_color_manual(values="red", guide="none")`. It's just a hack - there should be an easier way. Plus, suppose I want to use a color scale for something else in the plot, say color the points based on some grouping variable and make everything else red. – jlhoward Sep 15 '15 at 18:00
  • @PirateGrunt another reason would be for dark themed plots. There the only challenge is to set the geom related color (dots, box plots, lines etc.) – Saren Tasciyan Jul 30 '20 at 16:49

2 Answers2

32

You can set a default color for each geometry type this way:

update_geom_defaults("point",   list(colour = "red"))
update_geom_defaults("line",   list(colour = "red"))

ggplot(df, aes(x=x)) + 
  geom_point(aes(y=y), size=3) +
  geom_line(aes(y=fit)) +
  geom_line(aes(y=fit+Z*se.fit), linetype=2)+
  geom_line(aes(y=fit-Z*se.fit), linetype=2)

Edit If you want to do to everything then use (Edit borrow from here):

params <- ls(pattern = '^geom_', env = as.environment('package:ggplot2'))
geoms <- gsub("geom_", "", params)

lapply(geoms, update_geom_defaults, list(colour = "red"))
lapply(geoms, update_geom_defaults, list(fill = "red", colour = "red")) ## include fills 

If you want to set the default colour for the just one plot, simply do:

ggplot(df, aes(x=x, colour="red")) + 
  geom_point(aes(y=y), size=3) +
  geom_line(aes(y=fit)) +
  geom_line(aes(y=fit+Z*se.fit), linetype=2)+
  geom_line(aes(y=fit-Z*se.fit), linetype=2)
Community
  • 1
  • 1
metasequoia
  • 7,014
  • 5
  • 41
  • 54
  • 4
    Wow, I never knew about that function. Amazing. – joran Jan 16 '14 at 23:38
  • Thanks but this is not quite what I was looking for. I'm trying to set the default color *for just this ggplot object*, in the same sense that calling `ggplot(df)` makes `df` the default dataset for this object. According to the documentation, `update_geom_default(...)` sets the defaults for all future plots in this session. – jlhoward Jan 17 '14 at 01:54
  • Amended to reflect that distinction. @Blue Magister, is the amendment what you suggested earlier? If so, please resubmit for attribution! – metasequoia Jan 17 '14 at 02:48
  • 2
    @metasequoia Amazing function! However, there is an issue with your code because it maps the colour aesthetic to a variable 'red', try changing it to 'green' and you'll see the lines and points are still colored red. – americo Jan 17 '14 at 14:45
  • Is there a way to do this with multiple colors, for instance with geom_col when there are 3 categories. – jzadra Feb 22 '18 at 23:18
  • @amzu though `aes(colour = "red")` doesn't throw any error, technically it is wrong. It assigns default `ggplot` color to all data and not red color. The alternative is `plot + scale_color_manual( breaks = NULL , values = "red")` – Chirag Jul 16 '19 at 04:37
2

In order to replace a geom default aesthetic with another one (for all geoms using that aesthetic), you can try the following code.

First define a function for getting default aes settings of all geoms from ggplot2

library(ggplot2)
library(purrr)

geom_aes_defaults <- function() {
  geom_names <- apropos("^Geom", ignore.case = FALSE)
  geoms <- mget(geom_names, env = asNamespace("ggplot2"))
  map(geoms, ~ .$default_aes)
}

With geom_aes_defaults() you obtain a long list of all geom aesthetic mappings

$Geom
Aesthetic mapping:
<empty>

$GeomAbline
Aesthetic mapping:
* `colour`   -> "black"
* `size`     -> 0.5
* `linetype` -> 1
* `alpha`    -> NA

$GeomAnnotationMap
Aesthetic mapping:
* `colour`   -> "NA"
* `fill`     -> "grey20"
* `size`     -> 0.5
* `linetype` -> 1
* `alpha`    -> NA

$GeomArea
Aesthetic mapping:
* `colour`   -> NA
* `fill`     -> "grey20"
* `size`     -> 0.5
* `linetype` -> 1
* `alpha`    -> NA

...

The following function iterates over all geoms matching a given aesthetic and substitutes the corresponding values

replace_geom_aes_defaults <- function(name, old_aes, new_aes) {
  matching_geoms <- 
    map(geom_aes_defaults(), name) %>%
      compact() %>%
      keep(~ !is.na(.) & . == old_aes)
  geoms <- gsub("^Geom(.*)", "\\1", names(matching_geoms))
  walk(geoms, update_geom_defaults, setNames(list(new_aes), name))
}

Now you can replace colors systematically, e.g. turn black into red by

replace_geom_aes_defaults("colour", "black", "red")

or even replace fill colors (for bar plots) by

replace_geom_aes_defaults("fill", "grey35", "red")
spren9er
  • 744
  • 8
  • 11