14

If you examine C# code in Reflector, you can notice special compiler-generated local variables that are named with the pattern CS$X$Y. These variables were (unofficially) documented in this answer.

Is there any way to view these values via the Watch window in Visual Studio, or via the VS Debugger Extensibility API?

I'm asking specifically about the regular Visual Studio debugger, please do not answer that this is possible via windbg/sos/sosex - as that's not what I'm looking for.

Community
  • 1
  • 1
Omer Raviv
  • 11,409
  • 5
  • 43
  • 82

2 Answers2

33

Unfortunately there is no way to do this with the C# EE. The names for these locals are indeed stored in the PDB and available. However the C# EE will filter out all temporary values during debugging to reduce clutter. This filtering is unconditional and cannot be overridden. C# is not alone here as this is the behavior in every language.

The good news though is that every language uses different naming patterns for their temporaries. This means a temporary name in C# will run right past the filtering of the VB EE. Even though it's an illegal identifier the VB EE still considers it a valid local (and vice versa). Hence you just need to temporarily switch the debugging engine for C# code to the VB EE and the locals will become visible

Here is how to do this

  • Close all instances of Visual Studio (this is really important)
  • Open up regedit
  • Navigate to HKEY_CURRENT_USER\Software\Microsoft\VisualStudio\12.0_Config\AD7Metrics\ExpressionEvaluator\{3F5162F8-07C6-11D3-9053-00C04FA302A1}\{994B45C4-E6E9-11D2-903F-00C04FA302A1}
  • Change the value of CLSID from {60F5556F-7EBC-4992-8E83-E9B49187FDE3} to {59924502-559A-4BB1-B995-5D511BB218CD}

Now whenever you debug C# code it will use the VB EE and hence display temporaries as normal locals. Note that this is completely unsupported. But it should work fine. I was able to see raw closure values with this trick on my machine and poke around a bit without any issues.

Note that these instructions are specific to Visual Studio 2013. If you are using 2012, or 2010 it should work by changing the 12.0_Config in the registry key name to

  • 2012 use 11.0_Config
  • 2010 use 10.0_Config

It may need a few tweaks on top of that (didn't actually test older versions). If you run into any problems there let me know and I'll try and get it working locally and update the instructions

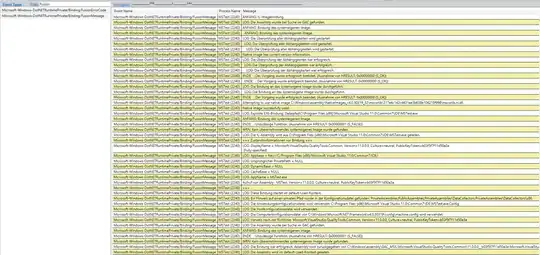
Here is a pic of the final output once you make this change

enter image description here

JaredPar
  • 733,204
  • 149
  • 1,241
  • 1,454
  • Wow :) Only thing though, i'd like to somehow find a solution that doesn't hamper the C# debugging experience. Is there any way to programmatically load up the VB.Net EE side-by-side with the C# one? Otherwise, is there any hidden API I could use to ask the EE to hand over the ICorDebugFrame it's using internally and query it myself? – Omer Raviv Feb 08 '14 at 08:22
  • I tend to think such re-wiring of an Expression Evaluation request is possible due to the nature of IntelliTrace "Calls and Events" mode - when I look at the Locals window at a 'live' context, it looks like it goes to the usual EE, whereas if it's a historical context, it goes to something else that appears to be implemented inside "Microsoft.IntelliTrace.Debugger.12.0.0.dll" – Omer Raviv Feb 08 '14 at 08:43
  • 1
    @OmerRaviv IIRC the IntelliTrace window works in a very different way than the EE code base. It's been a long time since I chatted with those guys but I believe they essentially have a parallel EE that just looks like the C# and VB EE but really is different. – JaredPar Feb 08 '14 at 17:14
  • 1
    @OmerRaviv don't believe either EE has a hidden API to give back the ICorDebugFrame used to get a given IDebugProperty2 instance (100% sure on VB, pretty certain for C#). You would have to go through the debugger APIs to get it and I'm not sure they provide it anywhere – JaredPar Feb 08 '14 at 17:20
  • 1
    @OmerRaviv i'm not sure if it helps or not but the EEs do support SxS loading. This is actually what happens when you debug projects that contain assemblies of different languages. I'm not sure how you would drive that from the outside though as the debugger holds all of the necessary interfaces – JaredPar Feb 08 '14 at 17:22
  • @OmerRaviv one thing you could try is rewriting the PDB to not have the temporary names. give them fake names and C# will load them just fine. – JaredPar Feb 08 '14 at 17:23
2

No, they are not added to the PDB file. The debugger simply has no way to discover them, nor know anything about where they are stored. This is all entirely intentional.

Hans Passant
  • 922,412
  • 146
  • 1,693
  • 2,536
  • 3
    Some of the values with a CS$ prefix are stored into the PDB, the EE code just filters them out when displaying locals – JaredPar Feb 05 '14 at 17:50