I wan to debug with Nsight but the compiler do not stop in break points. I have enabled the option that generates debug information.
Here is the command line:
Driver API (NVCC Compilation Type is .cubin, .gpu, or .ptx)
set CUDAFE_FLAGS=--sdk_dir "C:\Program Files (x86)\Microsoft SDKs\Windows\v7.0A\" "C:\Program Files\NVIDIA GPU Computing Toolkit\CUDA\v5.5\bin\nvcc.exe" --use-local-env --cl-version 2010 -ccbin "c:\Program Files (x86)\Microsoft Visual Studio 10.0\VC\bin\x86_amd64" -G --keep-dir x64\Debug -maxrregcount=0 --machine 32 --compile -cudart static -o MP7.dir\Debug\%(Filename)%(Extension).obj "%(FullPath)"
Runtime API (NVCC Compilation Type is hybrid object or .c file)
set CUDAFE_FLAGS=--sdk_dir "C:\Program Files (x86)\Microsoft SDKs\Windows\v7.0A\" "C:\Program Files\NVIDIA GPU Computing Toolkit\CUDA\v5.5\bin\nvcc.exe" --use-local-env --cl-version 2010 -ccbin "c:\Program Files (x86)\Microsoft Visual Studio 10.0\VC\bin\x86_amd64" -G --keep-dir x64\Debug -maxrregcount=0 --machine 32 --compile -cudart static -g -Xcompiler "/EHsc /nologo /Zi " -o MP7.dir\Debug\%(Filename)%(Extension).obj "%(FullPath)"
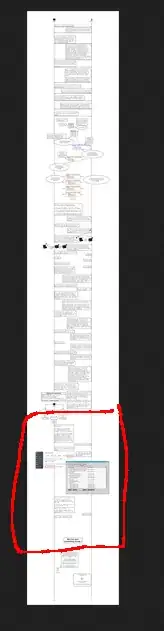
When the Nsight debuger starts the break point changes and an exclamation mark appear with the following box info:
The break point will not be currently be hit No CUDA device code for source file c:\users\..\file.cu. Did you enable device information in your project?
Both .ilk and .pdb files are in the same folder with the .exe. Also, in the Nsight debugger as Working directory that folder that includes the aforementioned files was set.
Moreover, breaking points were set inside the kernel functions.
How can I find out what is wrong? I am in a deadlock.
Thank you!
PS: Win 7 64x, VS2010 64x solution, Nsight 3.2 64x, Cuda sdk 5.5 64x, Nsight is working fine in sdk samples, GeForce 9600 GT (compute capability 1.1)