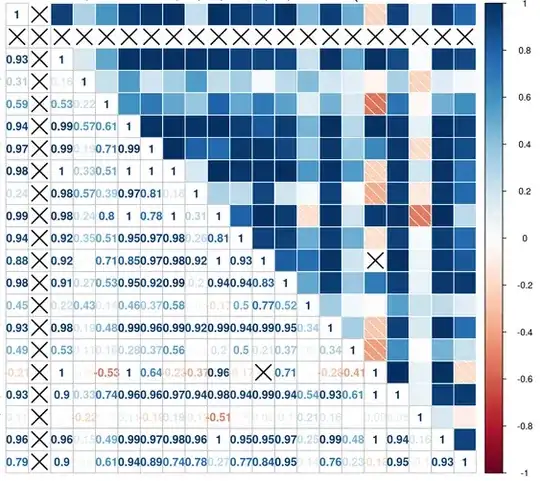
I want to draw a plot of correlations.
features = features[,-2]
features<- scale(features[2:ncol(features)],center=TRUE,scale=TRUE);
correlationmatrix <- cor(features)
corrplot(correlationmatrix, order = "hclust")
Until the 3rd line, everything works fine. When running corrplot(), I am getting:
Error in if (min(corr) < -1 - .Machine$double.eps || max(corr) > 1 + .Machine$double.eps) { : missing value where TRUE/FALSE needed
