3

Through various resources I found that you can create custom descriptions and even custom object summaries in LLDB. I'm also aware that I can do "Add Expression" in order to display the value of a property for a Apple framework class that the debugger hides from us.

What I want is to display the framework class object as if the source code were available for it.

A picture says more than words ... what I have so far:


enter image description here


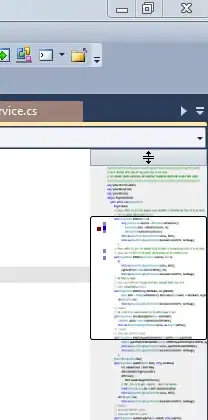
As you can see I have a SKLabelNode named _label in scope. I managed to add a custom summary string ("these are words") next to SKNode via Python scripting following the tutorials here and here.

I can also see the _label.fontName and _label.text but that's only because I right-clicked and did "Add Expression" manually for each property.

My questions:

  1. Is it possible (and if so how) to add an object's properties to its tree view via Python LLDB scripts? What I want is the _label object to expand and then always display its fontName, text and other properties like I have done by manually adding the expressions. Or in other words: it ought to behave as if full source code were available for that class.

  2. Alternatively: Is there a way to run "Add Expression" from the script so that I can create an alias that will quickly add multiple expressions? Perhaps one where I can add the object in question as a reference, for example command addCustomExpressionsWithObject _label.

I accept alternative solutions as well. For example if I could write proxy classes for each SK*Node class and somehow get LLDB to display the contents of a node's corresponding proxy class, that would also work. Whatever gets the job done, and preferably in a way that's automated (once implemented).


In general, how hard can it be to have the LLDB debugger display the (documented!) properties of a class from an Apple framework?

In particular for Sprite Kit we get no info on any SK*Node object whatsoever and I can't believe this hasn't bugged other developers using other Apple frameworks as hard as it bugs me. I hope there's a way to "fix" this but the little info I can find makes me think it's either not possible or I'm insane for wanting to see more details about Apple class objects.

PS: Yes, I've also looked into and customized Xcode 5.1's QuickLook functionality. I created a SpriteKit+QuickLook repository with QuickLook/debugDescriptions for some Sprite Kit classes but it's still not satisfactory as it serves only as a full class dump (better than nothing though).

Community
  • 1
  • 1
CodeSmile
  • 64,284
  • 20
  • 132
  • 217

1 Answers1

1

If you can run an expression that returns you the value of those properties, you can add a synthetic children provider to your SKLabelNode that has the result of evaluating each of those properties as a child of the LabelNode itself

More details on all of this are at the LLDB official website: http://lldb.llvm.org/varformats.html

Be warned, however: now whenever you stop in Xcode, no matter how corrupt your program state is, LLDB will try to run those expressions. That won't bring down the debugger in an ideal world, but it might certainly cause weird side effects in your inferior if those properties are not just reading some field

Also be warned that performance won't be anything exciting. At every stop or step where an SKLabelNode is involved, LLDB will run the code to compute the value of those properties (assuming your SKLabelNode is expanded, and the children visible, that is)

tl;dr there's a reason why the debugger does not show those properties by default - if you truly care, make a synthetic child provider that runs appropriate expressions

Enrico Granata
  • 3,303
  • 18
  • 25
  • Just to make a little clearer what Enrico said... Property accesses are, from the outside, always function calls, i.e. getting the value of foo.bar is really calling [foo bar]. That is not necessarily true in implementation, backed & synthesized properties are really just fancy ivar accesses. But the knowledge of whether that is true or not is stated in the @implementation part of the class, and you probably don't have debug info for implementation files for Apple's kit classes. So the debugger must call the getter function. And as Enrico says, calling functions is expensive. – Jim Ingham Mar 14 '14 at 02:11
  • Okay, thanks for pointing to "synthetic children", now at least I now which part of this extensive doc I should focus on. – CodeSmile Mar 14 '14 at 09:01
  • Enrico, are you sure that Xcode supports synthetic children providers for Obj-C types? It seems to do drill down always. And when trying to run the provider in the console, using `CreateValueFromExpression` I get `ClangUserExpression::Execute called with no thread selected`. Which makes sense because `lldb.thread` returns `None`. Anyway, on the console we could just as well do `po` so it's less important for us. – Steven Kramer Sep 04 '14 at 09:04
  • Well, the question is pretty vague, so.. yes it does support it. How do I know? Because I maintain the provider for - say - NSArray. So yes in general it works. As for your specific case, you should not be using lldb.thread in a formatter.. you have an SBValue passed in to your formatter, so you can ask it for its process, then ask the process for the current thread, and use that - lldb.thread is only meant for interactive scripting use. – Enrico Granata Sep 05 '14 at 16:41