5

Today i stumbled upon an interesting performance problem with a stored procedure running on Sql Server 2005 SP2 in a db running on compatible level of 80 (SQL2000).

The proc runs about 8 Minutes and the execution plan shows the usage of an index with an actual row count of 1.339.241.423 which is about factor 1000 higher than the "real" actual rowcount of the table itself which is 1.144.640 as shown correctly by estimated row count. So the actual row count given by the query plan optimizer is definitly wrong!

alt text

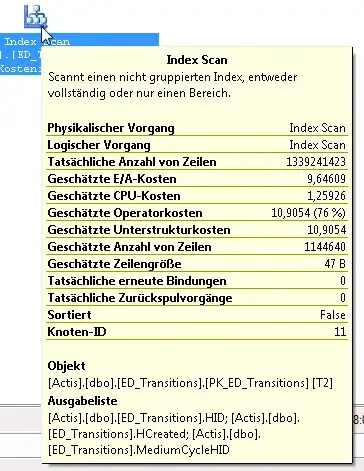
Interestingly enough, when i copy the procs parameter values inside the proc to local variables and than use the local variables in the actual query, everything works fine - the proc runs 18 seconds and the execution plan shows the right actual row count.

EDIT: As suggested by TrickyNixon, this seems to be a sign of the parameter sniffing problem. But actually, i get in both cases exact the same execution plan. Same indices are beeing used in the same order. The only difference i see is the way to high actual row count on the PK_ED_Transitions index when directly using the parametervalues.

I have done dbcc dbreindex and UPDATE STATISTICS already without any success. dbcc show_statistics shows good data for the index, too.

The proc is created WITH RECOMPILE so every time it runs a new execution plan is getting compiled.

To be more specific - this one runs fast:

CREATE  Proc [dbo].[myProc](
@Param datetime
)
WITH RECOMPILE 
as

set nocount on

declare @local datetime
set @local = @Param

select 
some columns
from 
table1
where
column = @local
group by
some other columns

And this version runs terribly slow, but produces exactly the same execution plan (besides the too high actual row count on an used index):

CREATE  Proc [dbo].[myProc](
@Param datetime
)
WITH RECOMPILE 
as

set nocount on

select 
some columns
from 
table1
where
column = @Param
group by
some other columns

Any ideas? Anybody out there who knows where Sql Server gets the actual row count value from when calculating query plans?

Update: I tried the query on another server woth copat mode set to 90 (Sql2005). Its the same behavior. I think i will open up an ms support call, because this looks to me like a bug.

Taryn
  • 242,637
  • 56
  • 362
  • 405
Jan
  • 15,802
  • 5
  • 35
  • 59

5 Answers5

6

Ok, finally i got to it myself.

The two query plans are different in a small detail which i missed at first. the slow one uses a nested loops operator to join two subqueries together. And that results in the high number at current row count on the index scan operator which is simply the result of multiplicating the number of rows of input a with number of rows of input b.

I still don't know why the optimizer decides to use the nested loops instead of a hash match which runs 1000 timer faster in this case, but i could handle my problem by creating a new index, so that the engine does an index seek statt instead of an index scan under the nested loops.

Jan
  • 15,802
  • 5
  • 35
  • 59
  • 1
    Glad you sorted it, Jan, and good spotting! Next time, maybe try outputting the plans in Text mode, and then using a textual diff or merge tool to compare them. You'll spot the difference(s) faster that way. – Rick Oct 24 '08 at 03:33
2

When you're checking execution plans of the stored proc against the copy/paste query, are you using the estimated plans or the actual plans? Make sure to click Query, Include Execution Plan, and then run each query. Compare those plans and see what the differences are.

Brent Ozar
  • 13,174
  • 14
  • 68
  • 91
  • I'm comparing the acutal plans. They are definitely the same. And its not a copy/paste version which runs quick, its the same proc, but using local var copies of the parameter values. I will edit my post to clarify. – Jan Oct 22 '08 at 14:20
1

It sounds like a case of Parameter Sniffing. Here's an excellent explanation along with possible solutions: I Smell a Parameter!

Here's another StackOverflow thread that addresses it: Parameter Sniffing (or Spoofing) in SQL Server

Community
  • 1
  • 1
Bob Probst
  • 9,533
  • 8
  • 32
  • 41
  • Yes, im aware of parameter sniffing. But i think my problem isn't about parameter sniffing, because i get the exactly same execution plan with using parameters and with copying parameter values to local vairables! – Jan Oct 22 '08 at 12:28
0

To me it still sounds as if the statistics were incorrect. Rebuilding the indexes does not necessarily update them.

Have you already tried an explicit UPDATE STATISTICS for the affected tables?

Tomalak
  • 332,285
  • 67
  • 532
  • 628
  • Yes, i already executed UPDATE STATISTICS on the table. As i wrote, the output from DBCC Show_Statistics is showing the right row count. I just wonder wtf SqlServer gets this large value on actual row count. There are no deletes on that table, so row count was never that high! – Jan Oct 22 '08 at 11:43
0

Have you run sp_spaceused to check if SQL Server's got the right summary for that table? I believe in SQL 2000 the engine used to use that sort of metadata when building execution plans. We used to have to run DBCC UPDATEUSAGE weekly to update the metadata on some of the rapidly changing tables, as SQL Server was choosing the wrong indexes due to the incorrect row count data.

You're running SQL 2005, and BOL says that in 2005 you shouldn't have to run UpdateUsage anymore, but since you're in 2000 compat mode you might find that it is still required.

Rick
  • 4,575
  • 1
  • 26
  • 20
  • sp_spaceused tells me correct data: ED_Transitions rows 1145711 data 160048 KB index_size 106048 KB – Jan Oct 22 '08 at 22:23