1

I need to draw the following function, which is what I call theory data

enter image description here

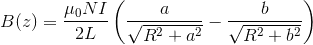
with a=z-(L/2) b=z+(L/2) for the following case

  • N=75
  • I=1
  • L=0.16
  • R=0.013

for z between -0.011 and 0.011. My guess is that there are underflow issues. The code is as follows

import numpy as np
import matplotlib.pyplot as plt

class Solenoid():

def __init__(self,N,I,L,R):
    self.N=N
    self.I=I
    self.L=L
    self.R=R

def field(self,z):

    mu=4*(np.pi)*(10 ** -7)

    coef=(mu*self.N*self.I)/(2*self.L)

    a=z+(self.L/2)
    b=z-(self.L/2)

    sum_a=a/((self.R ** 2 + a ** 2) ** 0.5)

    sum_b=b/((self.R ** 2 + b ** 2) ** 0.5)

    return (coef*(sum_a - sum_b))

sol=Solenoid(75,1,0.160,0.013)
x=np.linspace(-0.011, 0.011, 10000)
y=[]

for point in x:
    y.append(sol.field(point))

plt.plot(x,y)
plt.show()  

The output is

enter image description here

which is plain wrong. The expected output is a more or less smooth line along with experimental data:

enter image description here

UPDATE New output is

enter image description here

Jorge Lavín
  • 937
  • 8
  • 22
  • 10^-3 shouldn't cause an underflow! – gat Mar 29 '14 at 14:10
  • the variables sum_a and sum_b are quite close, and they are substracted – Jorge Lavín Mar 29 '14 at 14:11
  • Why don't you try printing their values at each step and see if that is indeed happening. – gat Mar 29 '14 at 14:14
  • unrelated: to avoid integer division add `from __future__ import division` at the top – jfs Mar 29 '14 at 14:28
  • you could [plot it using `sympy`](http://stackoverflow.com/a/16258924/4279). You could use [`lambdify()` to speed up things](http://stackoverflow.com/a/19864990/4279) – jfs Mar 29 '14 at 14:36

1 Answers1

0

It was a factor of 10 in the x scale ...

enter image description here

Jorge Lavín
  • 937
  • 8
  • 22