2

I am working on some performance test on HashMap insertion. Operations on which I am testing are insert, read and size in memory after insertion.

I am able to do, insert and read test but not sure how do I find out size in memory after insertion -

I have a text file which contains 2 million english words with their frequencies in this format -

hello 100
world 5000
good 2000
bad 9000
...

Now I am reading this file line by line and storing it in HashMap so I am able to measure the insertion performance with the below code.

Map<String, String> wordTest = new HashMap<String, String>();

try {
    fis = new FileInputStream(FILE_LOCATION);
    reader = new BufferedReader(new InputStreamReader(fis));

    String line = reader.readLine();
    long startTime = System.nanoTime();
    while (line != null) {
    String[] splitString = line.split("\\s+");
    // now put it in HashMap as key value  pair
    wordTest.put(splitString[0].toLowerCase().trim(), splitString[1].trim());

    line = reader.readLine();
    }
    long endTime = System.nanoTime() - startTime;
    System.out.println("Insertion Time: " +TimeUnit.MILLISECONDS.convert(endTime, TimeUnit.NANOSECONDS));
}

Now I would also like to measure size in memory after insertion in my above HashMap.

Basically I am confuse after taking a look from this link - https://github.com/jpountz/tries/wiki/Benchmark. In this link they have size in memory after insertion but not sure what does it mean and how they have calculated it? Is there any way I can do the same thing in Java?
AKIWEB
  • 19,008
  • 67
  • 180
  • 294
  • What you're measuring is in fact the time it takes to read a file, splitting its lines, transform to lowercase and trimming. Not much to do with HashMap insertion time. – JB Nizet Apr 13 '14 at 07:55
  • @JBNizet: hmmm.. How can I improve that and just measure the time it takes for insertion in the HashMap from my current example? Any example will help me in my understanding. – AKIWEB Apr 13 '14 at 07:56
  • micro-benchmarks are a quite complex thing to do in Java. But the first step would of course to measure what you want to measure, and nothing else. What are you trying to achieve? What will your benchmark tell you that the javadoc and numerous benchmarks already existing haven't told you yet? – JB Nizet Apr 13 '14 at 07:59
  • @JBNizet: It is just for my fun which I am trying to do. And yes excatly, I want to measure only HashMap read and insert and size in memory performance. I don't want to achieve the best benchmark result. Just the right way and which can clear my understanding of how to benchmark HashMap read and insert performance. That's all. I know my benchmark result will be different as compared to others but I am just trying to do right way. – AKIWEB Apr 13 '14 at 08:01
  • Then use a micro-benchmarking tool like Caliper (https://code.google.com/p/caliper/). And insert data that is readily available in memory, and doesn't take any time to get or compute. Inserting to a HashMap is like going to the next room. Reading a file is like going to Mars. – JB Nizet Apr 13 '14 at 08:05
  • @JBNizet: :) I already know about Caliper. But I am more interested in doing from my program. Is there any way, I can improve my current example? – AKIWEB Apr 13 '14 at 08:09
  • Caliper measures what you ask it to measure. But it does it correctly. If you also want to do it correctly, you'll have to do what Caliper does: execute your piece of code many many times before actually measuring it, etc. – JB Nizet Apr 13 '14 at 08:11
  • Yes but before I do that, I need to fix the issue you told me in your first comment. If that gets fixed, I will be executing it many times and then measuring it. – AKIWEB Apr 13 '14 at 08:13

4 Answers4

15

Once again, I wish to note it is possible to get the exact memory footprint measurement for Java object, if you tap into VM's mind with Unsafe. There are plenty of projects that use that technique, and one of them is jol, available in OpenJDK (which means it works with Oracle JDKs as well). For example, this is the runnable sample showing the ArrayList vs LinkedList footprints:

Running 64-bit HotSpot VM.
Using compressed references with 3-bit shift.
Objects are 8 bytes aligned.
Field sizes by type: 4, 1, 1, 2, 2, 4, 4, 8, 8 [bytes]
Array element sizes: 4, 1, 1, 2, 2, 4, 4, 8, 8 [bytes]

java.util.ArrayList instance footprint:
 COUNT   AVG   SUM DESCRIPTION
     1  4952  4952 [Ljava.lang.Object;
  1000    16 16000 java.lang.Integer
     1    24    24 java.util.ArrayList
  1002       20976 (total)


java.util.LinkedList instance footprint:
 COUNT   AVG   SUM DESCRIPTION
  1000    16 16000 java.lang.Integer
     1    32    32 java.util.LinkedList
  1000    24 24000 java.util.LinkedList$Node
  2001       40032 (total)

You can pull jol as the dependency, and feed your HashMap instance to it.

Aleksey Shipilev
  • 18,599
  • 2
  • 67
  • 86
2

Although using an external tool is a viable solution, the easy Java way is:

long myTotalMemoryBefore = Runtime.getRuntime().totalMemory();

/* Fill the hash Table */

long myTotalMemoryAfter = Runtime.getRuntime().totalMemory();
long myHashMapMemory = myTotalMemoryAfter - myTotalMemoryBefore;

The values are in bytes, do divide by 1024 to Kbytes,etc...

Details here:

http://docs.oracle.com/javase/7/docs/api/java/lang/Runtime.html#totalMemory%28%29

and here:

What are Runtime.getRuntime().totalMemory() and freeMemory()?

Community
  • 1
  • 1
Alexandros
  • 2,160
  • 4
  • 27
  • 52
1

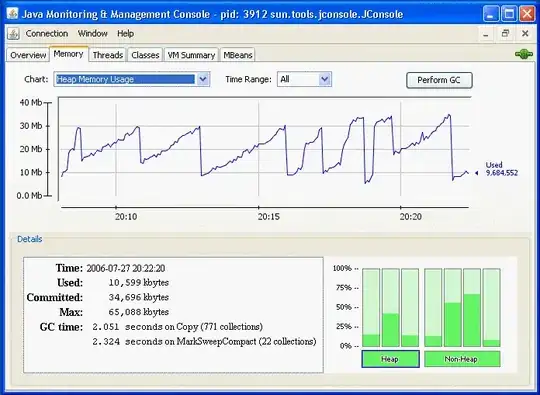
you need a tool such as jconsole to beter monitor the memory at runtime.

enter image description here

Farvardin
  • 5,336
  • 5
  • 33
  • 54
  • Can we not use Java code to get the size in memory after insertion? – AKIWEB Apr 13 '14 at 08:02
  • basically java code for measuring memory of a java program at runtime is a bad-practice because measures are not always precise. – Farvardin Apr 13 '14 at 08:05
  • @طاهر: and how do you think that jconsole measures memory, if not by calling Java methods returning the available/used memory? See http://docs.oracle.com/javase/7/docs/api/java/lang/Runtime.html – JB Nizet Apr 13 '14 at 08:07
  • That's fine I guess. I don't need to have precise measurement. Just rough idea will be fine. – AKIWEB Apr 13 '14 at 08:07
  • @JBNizet i think jconsole uses a JMX connection to JVM (services provided by JVM itself) and so it may be more precise. – Farvardin Apr 13 '14 at 08:13
  • @طاهر JMX is a way of calling methods exposed by MBeans remotely. It is not magic. There is nothing to stop you from calling _exactly the same_ methods from your code. – Boris the Spider Apr 14 '14 at 09:06
-4

Check your task manager and have a look how large java.exe is. Best way to see changes while running your program is you kill the java.exe, that will also stop your server if you run one. Than start your application again, check java.exe size befor your do sth. with your hashmap, than trigger the hashmap action and check java.exe again. I dont know if you will see changes if you only save a small amount of data, what you will see directly is if you try to save 1GB file in your hasmap. To do this you need to increase your java heap befor. I dont know if this example is working but here is an example how you could get your memory size while running your application.

How to increase the java heap

Community
  • 1
  • 1
Andy_Lima
  • 129
  • 12