27

I have a dataframe with numerous columns (≈30) from an external source (csv file) but several of them have no value or always the same. Thus, I would to see quickly the value_counts for each column, how can i do that?

For example

  Id, temp, name
1 34, null, mark
2 22, null, mark
3 34, null, mark

Would return me an object stating that

  • Id: 34 -> 2, 22 -> 1
  • temp: null -> 3
  • name: mark -> 3

So I would know that temp is irrelevant and name is not interesting (always the same)

Cory Kramer
  • 114,268
  • 16
  • 167
  • 218
Edouard
  • 313
  • 1
  • 4
  • 9
  • Loop over the columns and print a `value_counts` for each? – joris Apr 21 '14 at 12:30
  • What @joris said. There's an [issue](https://github.com/pydata/pandas/pull/5381) To add a `value_counts` method to DataFrame, but there are a few issues to do with index alignment. – TomAugspurger Apr 21 '14 at 13:01

6 Answers6

28

For the dataframe,

df = pd.DataFrame(data=[[34, 'null', 'mark'], [22, 'null', 'mark'], [34, 'null', 'mark']], columns=['id', 'temp', 'name'], index=[1, 2, 3]) 

the following code

for c in df.columns:
    print "---- %s ---" % c
    print df[c].value_counts()

will produce the following result:

---- id ---
34    2
22    1
dtype: int64
---- temp ---
null    3
dtype: int64
---- name ---
mark    3
dtype: int64
tanemaki
  • 4,849
  • 1
  • 12
  • 6
  • Thanks for your comments and answer. I thought it was possible to do it without a loop but it seems it is not. (and yep i've seen the issue mentioned, hope it will be possible soon :)). – Edouard Apr 22 '14 at 07:56
  • 1
    Actually, why not do it with a map like : map(lambda x : x.value_counts(), mdf.columns) – Edouard May 09 '14 at 06:23
  • 1
    @Edouard, I think code in your last comment needs to be `map(lambda x : mdf[x].value_counts(), mdf.columns)` – alancalvitti Jan 15 '19 at 20:44
  • `to_frame()` and `display()` functions would be useful for an enhanced output , eg: `for c in df.columns: display(df[c].value_counts().to_frame())` – Ikbel Oct 29 '19 at 15:24
12

you can use df.apply which will apply each column with provided function, in this case counting missing value. This is what it looks like,

df.apply(lambda x: x.isnull().value_counts())

Napitupulu Jon
  • 7,713
  • 3
  • 22
  • 23
  • This creates a series with all three columns. How to split the columns and create a dataframe with 3 columns? – Xtiaan Jun 16 '23 at 10:08
10

A nice way to do this and return a nicely formatter series is combining pandas.Series.value_counts and pandas.DataFrame.stack.

For the DataFrame

df = pandas.DataFrame(data=[[34, 'null', 'mark'], [22, 'null', 'mark'], [34, 'null', 'mark']], columns=['id', 'temp', 'name'], index=[1, 2, 3]) 

You can do something like

df.apply(lambda x: x.value_counts()).T.stack()

In this code, df.apply(lambda x: x.value_counts()) applies value_counts to every column and appends it to the resulting DataFrame, so you end up with a DataFrame with the same columns and one row per every different value in every column (and a lot of null for each value that doesn't appear in each column).

After that, T transposes the DataFrame (so you end up with a DataFrame with an index equal to the columns and the columns equal to the possible values), and stack turns the columns of the DataFrame into a new level of the MultiIndex and "deletes" all the Null values, making the whole thing a Series.

The result of this is

id    22      1
      34      2
temp  null    3
name  mark    3
dtype: float64
Martín Fixman
  • 9,055
  • 9
  • 38
  • 46
6

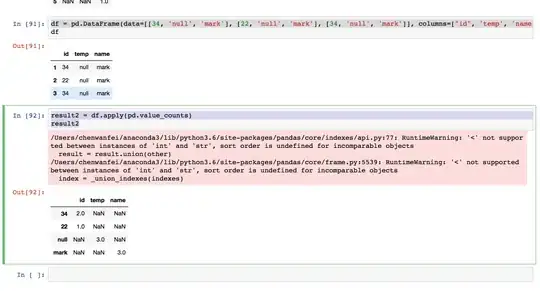
Code like the following

df = pd.DataFrame(data=[[34, 'null', 'mark'], [22, 'null', 'mark'], [34, 'null', 'mark']], columns=["id", 'temp', 'name'], index=[1, 2, 3]) 
result2 = df.apply(pd.value_counts)
result2

will produce:

enter image description here

Jagie
  • 2,190
  • 3
  • 27
  • 25
1

This is similar to @Jagie's reply but in addition:

  1. Put zero for values absent in a column
  2. Convert the counts to integer
    df = pd.DataFrame(
        data=[[34, 'null', 'mark'], [22, 'null', 'mark'], [34, 'null', 'mark']],     
        columns=["id", 'temp', 'name'], 
        index=[1, 2, 3]
    )
    result2 = df.apply(pd.value_counts).fillna(0).astype(int)
Dr Fabio Gori
  • 1,105
  • 16
  • 21
0

You can replace:

fillna(0).astype(int)

to

fillna(0, downcast='infer')
Azametzin
  • 5,223
  • 12
  • 28
  • 46