1

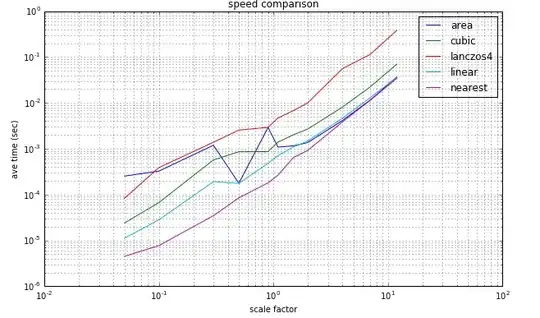
I have to create Graphs like this image below, I tried to use gnuplot and zplot to create this, but the patterns are not as expected. Did someone know some library or anything to create this pattern(as image bellow). I appreciate for that. Thanks
enter image description here

Zahaib Akhtar
  • 1,068
  • 2
  • 11
  • 26
indi60
  • 867
  • 4
  • 17
  • 34

1 Answers1

3

What you need is the following histogram type with different fill style patterns

For example if you would want a black&white stacked histogram, then you could create them by doing the following:

file1 = 'hist1.dat'

set style data histogram
set style histogram rowstack
set style fill pattern

set xtics border in scale 0,0 nomirror rotate by 90  offset character 0, -6, 0
set boxwidth 0.9 absolute

set key outside right top vertical Left
set key samplen 2.5 spacing 0.85

set ylabel "Cost BreakDown (%)" font ",18" offset character 2.5,0,0

 plot newhistogram , file1 u 2:xtic(1) t "Math" lc rgbcolor "black" lt 1 fs pattern 1, '' u 3 t "Innvocation" lc rgbcolor "black" lt 1  fs pattern 2

where the contents of file1 could be like this

Read-GetAttr 19 12 
Read-If-Mod 47 23 

The above will render the following graphic:

enter image description here

You can further add more layers on the stack by having the corresponding data and changing the fillstyle pattern fs. Further you can also change them to coloured histograms by using different rgbcolor values

Posting this here in case this may be useful for someone else in the future:

I also pulled up some work that I did previously, You can download a complete working example of coloured stacked Histograms with data files and gnuplot script from the following link:

Coloured Stacked Histograms Working Example

Zahaib Akhtar
  • 1,068
  • 2
  • 11
  • 26
  • @indi60 Note, that the patterns may vary a bit depending on your output terminal. Use the `test` command (see e.g. http://stackoverflow.com/a/19420678/2604213) to see the available patterns. – Christoph Apr 22 '14 at 18:47
  • @Christop brings up a good point. I should add that the plot above was generated by output terminal set to `set term pngcairo`, you could use others such as `set term post eps` according to your need. – Zahaib Akhtar Apr 22 '14 at 18:53
  • @ZahaibAkhtar thanks for explanation. Yes I understand to created it now. But here, gnuplot only have 8 pattern. what do you suggestion if we have more that 8 legend. – indi60 Apr 23 '14 at 02:45
  • @Christoph, yes I am doing what you suggest. but still need more pattern option for this. thanks – indi60 Apr 23 '14 at 02:47
  • 1
    You may want to use colours in addition to the fill style patterns in order to distinguish them or try a different output terminal which may allow more than 9 patterns. – Zahaib Akhtar Apr 23 '14 at 02:56
  • 1
    I know, that the `lua tikz` terminal has 12 patterns, see [Fill bars in gnuplot with dots or other patterns](http://stackoverflow.com/a/23034300/2604213) for an example, also about customizing the fill patterns. – Christoph Apr 23 '14 at 07:09
  • Was anyone able to reproduce the exact same patterns presented in the image with the eps or pdfcairo terminal ? Because I cannot ... – Valerio Schiavoni Oct 22 '15 at 12:12
  • @ValerioSchiavoni with `set term post eps color` I'm getting exactly the same pattern on an eps. – Zahaib Akhtar Oct 22 '15 at 23:47
  • @ValerioSchiavoni Ahh I see, I was referring to my solution. Haven't checked the patterns in the original image, not sure if the original image was generated using Gnuplot in the first place. I guess only OP can answer that. – Zahaib Akhtar Oct 23 '15 at 14:23