My django application has become painfully slow on the production. Probably it is due to some complex or unindexed queries.
Is there any django-ish way to profile my application?
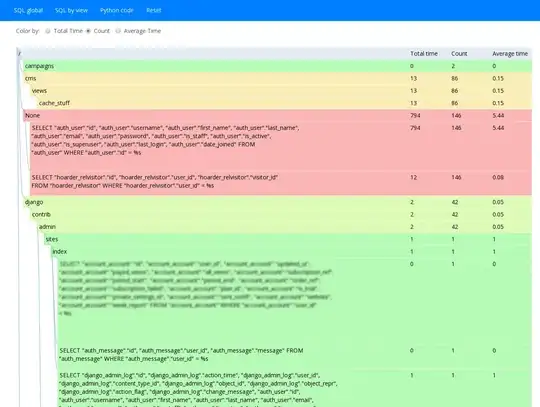
Try the Django Debug Toolbar. It will show you what queries are executed on each page and how much time they take. It's a really useful, powerful and easy to use tool.
Also, read recommendations about Django performance in Database access optimization from the documentation.
And Django performance tips by Jacob Kaplan-Moss.
Just type "django-profiling" on google, you'll get these links (and more):
http://code.djangoproject.com/wiki/ProfilingDjango
http://code.google.com/p/django-profiling/
http://www.rkblog.rk.edu.pl/w/p/django-profiling-hotshot-and-kcachegrind/
Personally I'm using the middleware approach - i.e. each user can toggle a "profiling" flag stored in a session, and if my profiling middleware notices that a flag has been set, it uses Python's hotshot module like this:
def process_view(self, request, view_func, view_args, view_kwargs):

     # setup things here, along with: settings.DEBUG=True
     # to get a SQL dump in connection.queries

     profiler = hotshot.Profile(fname)
     response = profiler.runcall(view_func, request, *view_args, **view_kwargs)
     profiler.close()

     # process results

     return response
EDIT: For profiling SQL queries http://github.com/robhudson/django-debug-toolbar mentioned by Konstantin is a nice thing - but if your queries are really slow (probably because there are hundreds or thousands of them), then you'll be waiting insane amount of time until it gets loaded into a browser - and then it'll be hard to browse due to slowness. Also, django-debug-toolbar is by design unable to give useful insight into the internals of AJAX requests.
EDIT2: django-extensions has a great profiling command built in:
https://github.com/django-extensions/django-extensions/blob/master/docs/runprofileserver.rst
Just do this and voila:
$ mkdir /tmp/my-profile-data
$ ./manage.py runprofileserver --kcachegrind --prof-path=/tmp/my-profile-data
Shameless plug here, but I recently made https://github.com/django-silk/silk for this purpose. It's somewhat similar to django toolbar but with history, code profiling and more fine grained control over everything.
For profiling data access (which is where the bottleneck is most of the time) check out django-live-profiler. Unlike Django Debug Toolbar it collects data across all requests simultaneously and you can run it in production without too much performance overhead or exposing your app internals.
I needed to profile a Django app recently and tried many of these suggestions. I ended up using pyinstrument instead, which can be added to a Django app using a single update to the middleware list and provides a stack-based view of the timings.
Quick summary of my experience with some other tools:
pyinstrumentcProfile timings and automatically displays ajax timings, both of which can be really helpful.Compared to the other tools I tried, pyinstrument was dramatically easier to install and to use.
For all you KCacheGrind fans, I find it's very easy to use the shell in tandem with Django's fantastic test Client for generating profile logs on-the-fly, especially in production. I've used this technique now on several occasions because it has a light touch — no pesky middleware or third-party Django applications are required!
For example, to profile a particular view that seems to be running slow, you could crack open the shell and type this code:
from django.test import Client
import hotshot

c = Client()
profiler = hotshot.Profile("yourprofile.prof")  # saves a logfile to your pwd
profiler.runcall(c.get, "/pattern/matching/your/view/")
profiler.close()
To visualize the resulting log, I've used hotshot2cachegrind:
But there are other options as well:
When the views are not HTML, for example JSON, use simple middleware methods for profiling.
Here are a couple examples:
https://gist.github.com/1229685 - capture all sql calls went into the view
https://gist.github.com/1229681 - profile all method calls used to create the view
You can use line_profiler.
It allows to display a line-by-line analysis of your code with the time alongside of each line (When a line is hit several times, the time is summed up also).

It's used with not-Django python code but there's a little trick to use it on Django in fact: https://stackoverflow.com/a/68163807/1937033
I am using silk for live profiling and inspection of Django application. This is a great tool. You can have a look on it.