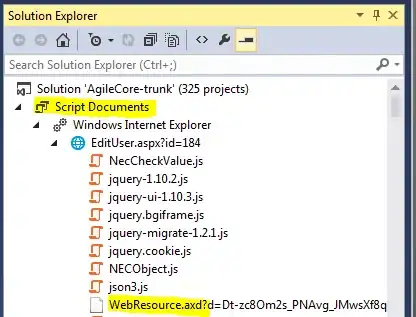
I want to be able to debug the client-side Javascript generated by WebForms for, say, a button click.
This should be trivial, but I can't find a simple way to do it.
The generated HTML looks like this:
<input type="submit" name="ctl00$Content$btnUpdate" value="Save"
    id="ctl00_Content_btnUpdate" class="StandardButton"
    onclick="javascript:WebForm_DoPostBackWithOptions(new WebForm_PostBackOptions(
                    "ctl00$Content$btnUpdate", "", true, "", "", false, false))"
    >
...and it's generated from this .aspx snippet:
<AGILE:Button ID="btnUpdate" runat="server" CssClass="StandardButton" Text="@Save@"
                    OnClick="btnUpdate_Click"/>
What's the fastest way to attach a debugger to the function WebForm_DoPostBackWithOptions(...) in Visual Studio (2013 FWIW)?
What about in Chrome Dev Tools?
What I've tried:
(see my answer below)