-5

I have this testdata :

      date      cpu_user cpu_id test1 test2 test3 test4
1 1386716402        U      U     U     U     U    31
2 1386716702        0   0.06 99.95  0.02 91.93    29
3 1386717002     0.01   0.04 99.97  0.03 19.46    29
4 1386717302     0.01   0.05 99.96  0.04 92.54    29
5 1386717602        0   0.04 99.97  0.04     U    29
6 1386717902        0   0.05 99.96  0.02 99.86    29

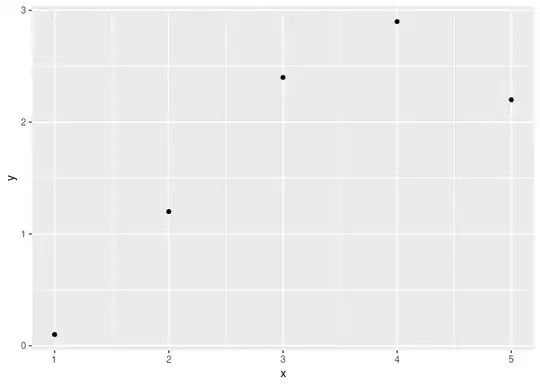
I want for example a freqpoly chart with date at x and the other(cpu_uder, cpu_id, ....) at y. Have someone an idea?

Thanks and best Regards!

tonytonov
  • 25,060
  • 16
  • 82
  • 98
user3181885
  • 49
  • 2
  • 9
  • What have you tried so far? By the way, because you store characters (U) together with numeric data in several columns, they will be converted to `character` which doesnt make sense for plotting. Does U mean NA? – talat May 15 '14 at 10:43
  • See for example these answers of me on earlier questions: [1](http://stackoverflow.com/questions/23319559/r-ggplot-focusing-in-region-and-different-scale-in-one-axis/23320069#23320069) / [2](http://stackoverflow.com/questions/23641636/insert-graph-legend-using-ggplot/23641788#23641788) – Jaap May 15 '14 at 11:04

1 Answers1

0
d <- read.table(text=readClipboard(), header=TRUE, stringsAsFactors = T,
                na.strings = 'U')
df <- melt(d, id.var='date')
ggplot(aes(x=date, y=value), data = df) +
  geom_bar(aes(fill = variable), stat = 'identity', position = 'dodge')

bar chart

or

ggplot(aes(x=factor(date), y=value), data = df) +
  geom_bar(stat = 'identity', position = 'dodge') +
  facet_grid(variable~., scales = 'free_y', drop = F) +
  theme(axis.text.x = element_text(angle = 45, vjust = 1.1, hjust = 1.05))

faceting option

Paulo E. Cardoso
  • 5,778
  • 32
  • 42
  • thank you very much...can you post an example for frecpoly please? – user3181885 May 15 '14 at 12:55
  • @user3181885 I'm afraid you cannot without frequency data. You provided a single entry for each test. geom_path instead? See [ggplot docs](http://docs.ggplot2.org/0.9.3.1/geom_freqpoly.html). – Paulo E. Cardoso May 15 '14 at 13:01
  • hmm is there no chance to create with my testdate a chart like this-->(for example) [link](http://www.datameer.com/documentation/download/attachments/33227118/Line_Chart.png?version=1&modificationDate=1310634467000&api=v2) – user3181885 May 15 '14 at 13:41
  • Yes, with geom_path(aes(colour = variable, group = variable)) and no faceting. – Paulo E. Cardoso May 15 '14 at 13:54