1

I'm trying to visualize some data I have in a C# form. I've been thinking of several ways I can do this, but can't figure out what would be the best way in C#.

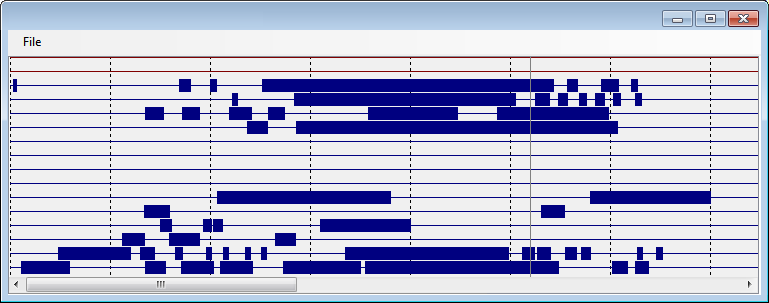
First, let me show an example I made in paint.

example
(source: interstyles.nl)

Some ways I figured I could do it :

  1. Draw one huge picture with all data in it, and just scroll the picture in the form. This is not very nice, since the data can become quite wide. Normally I'd expect to have data that's about 36000 pixels wide, so that would be quite a huge picture! so it's easy to program, but takes a lot of memory.

  2. Same as one, but have a separate picture for each row of data that's only 1 pixel high, and expand it when i show it on the screen. More difficult to program, but saves a lot of memory. Also makes it easier to sort data and turn rows on/off. In short the screen gets build up by several pictures above each other.

  3. Draw only the visible data in a picture the size of the form, depending on the position of the scrollbars. More difficult to program, and I wonder if this would be fast enough?

  4. There is also graphing capability in c#, but I can't find how to make something like this.

  5. Some other library that I didn't know about yet.

I'd also like if I could get information about a particular event when I hover my mousepointer over it, that would be difficult in options 1, 2 and 3.. or at least take quite some programming effort..

Suggestions please

Community
  • 1
  • 1
wvl_kszen
  • 183
  • 1
  • 10
  • I'd go with option `1`. If it doesn't work - improve it. The image looks like a [tracker](http://en.wikipedia.org/wiki/Music_tracker) to me. You can store your data in *optimized way*: begin/end time. This way you are not talking about thousands of pixels, but about few lines (which is pretty performance-wize). Depending on zoom, calculate x for beginning/end, draw. Does it sounds complicated? – Sinatr May 19 '14 at 12:15
  • Hi Sinatr, yes, the data itself is stored as the times when the data changes, so : 10s->on, 15s->off, etc. Opt.1 is drawing the whole picture in one go (1000*36000 pxls = 100MB! of data). Easy to program, but takes too much mem. I'm opting for option 3, which is just to raw the contents of the screen depending on the scrollbars (and form size), so eventdriven. That only takes the memory of the picture in the form, 800*600 pixels or so, but you have to redraw the picture when something changes + it's more of an effort to program. There must be an easier way to do it, but I can't find it. – wvl_kszen May 19 '14 at 12:26
  • `10s->on, 15s->off` - are you drawing [timing diagram](http://en.wikipedia.org/wiki/Digital_timing_diagram) ? How often do you get data? Every second (point or no point) or more/less often? What values are from 10s to 15s (from your comment example), are they all *high* (on) ? I am trying to figure out the most optimal format to store data and to draw graphs. – Sinatr May 19 '14 at 13:02

2 Answers2

0

Draw all visible points (you mentioned getting viewport based on scrollbar value and width is not a problem). You don't need to optimize much, just find minTime, maxTime and proceed all points. I doubt if it's really needed as trying to draw invible pixel will draw nothing and going through array is pretty fast anyway, drawing few pixels will take more than that.

Ensure you have double-buffering enabled:

[System.ComponentModel.DesignerCategory("Code")]
public class MyGraph : PictureBox
{
    public MyGraph()
    {
        SetStyle(ControlStyles.ResizeRedraw | ControlStyles.OptimizedDoubleBuffer | ControlStyles.UserPaint | ControlStyles.AllPaintingInWmPaint, true);
    }
    ...
}

If you really need to optimize something (to example, if you draw some information data as user moves mouse), then you can use cache to draw into bitmap and then just bitblt (DrawImage) bitmap. See this answer or search for graphics from bitmap. You will have to handle situation when cached data become invalid (on scroll, on resize, etc.).

Another possibility is to optimize update (to example, if your drawn data are getting updated periodically). For this you will need to provide a method in MyGraph to inform about what has changed in underlying data, to decide whenever cache become invalid or to update cached bitmap by drawing change right into it.

One more, really overhead, but optimization: you can keep data in something what is as close to bitmap as possible. That way draw function in MyGraph will simply draw bitmap (which is fast and will support client viewport). This way update is really as simple as changing that pixel and calling Invalidate().

Community
  • 1
  • 1
Sinatr
  • 20,892
  • 15
  • 90
  • 319
  • Everything is based on .1 seconds. 1 pixel equals .1 of a second, so a viewable area of 800 pixels = 80 seconds. I already know how much data is there : int TotalTenths and the starting point int StartTenth, also I have the amount of viewable data : int VisibleTenths. I already calculate those depending on the scrollbar (als the width of the scrollbar is set accordingly). – wvl_kszen May 19 '14 at 13:20
  • No plans for *zooming* and handling offset with just scrollbars? I see. – Sinatr May 19 '14 at 13:24
  • No, not at this moment :-) I only wish to scroll. Also I'd prefer to use some library or something existing. I can write my own code to show the data, no problem. I just want to know if there is an easier solution. I must have missed something or don't know what to google/search for. – wvl_kszen May 19 '14 at 13:26
  • See answer for some ideas. I'd still simply go with your option `1` and only bother to optimize anything after benchmarking. – Sinatr May 19 '14 at 13:48
0

One thing I hate are scrollbars that lie to me. So I agree with Siantr: Go for option 1, create the full size and don't try to optimize before you actually have a problem.

Probably the most often quoted remark on SO is Knuth's: premature optimization is the root of all evil

Especially option 2 sounds like the wrong way to go: The internal image bitmap will still have the full size, even if you create it from small chunks, so nothing is gained here, more likely lost.

You may want to choose a PixelFormat like Format16bppRgb555 or Format16bppRgb565 to save some memory; but I'm not sure if that actually will make a difference in memory. It certainly will when writing to a file but the Winforms internals have mysterious ways..

To show the event details, assuming you have a tooltip control toolTip1, you can simply use the cursor coordinates like this:

private void pictureBox1_MouseHover(object sender, EventArgs e)
{
  Point p = pictureBox1.PointToClient(Cursor.Position);
  string msg = String.Format("row {0}  column {1}", p.Y , p.X );
  toolTip1.SetToolTip(pictureBox1, msg);
}

The PointToClient() method is friendly enough to calculate to scrollposition for you.

Of course you will have to map the coordinates to your events.. And to get scrollbars in the first place you will have to use this old trick..

Community
  • 1
  • 1
TaW
  • 53,122
  • 8
  • 69
  • 111
  • In the end I've worked out option 3, drawing only what is supposed to be on the screen on-the-fly. Some tests with drawing everything at once (option 1) used way too much memory, so that wasnt to be. Drawing on-the-fly is more than fast enough and only took 20 lines of code in the end. – wvl_kszen May 22 '14 at 17:49
  • If it works it is good. How do you manage the scrollbar? Does it show the real scrolling amount? – TaW May 22 '14 at 18:26
  • Ofcourse it's showing the real amount :-) I've made a function that calculates the values of Scrollbar.Maxmimum and Scrollbar.Largechange, depending on the size of the screen and the total width of the data. – wvl_kszen May 23 '14 at 19:36