My question is very similar to this question but I wish to write special values on the x-axis.
I have the following code:
x <- c(1:12)
y <- c(1:12)
filled.contour(c(2,4,7,10,14,21,30,60,90,120,180,365), y, outer(x,y))
Gives the following plot :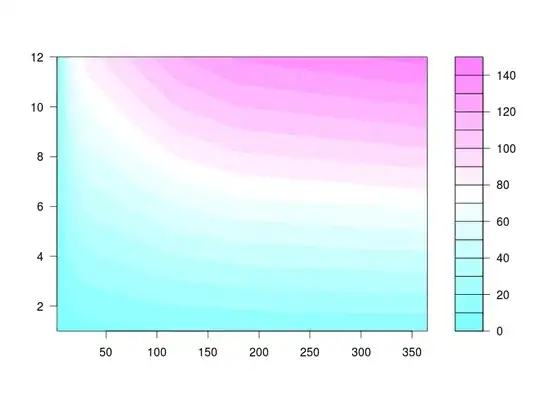
My problem is that I don't want the plot to be squeezed on the left but want all values in c(2,4,7,10,14,21,30,60,90,120,180,365) to be equally spaced on the x-axis.
How can I do this?
As an extension, how can I put characters "two", "four", ... instead of 2, 4, ... on the x-axis?
Thanks