It is generally assumed that using a profiler is much better (for finding performance problems, as opposed to measuring things) than - anything else, really - certainly than the bone-simple way of random pausing.
This assumption is only common wisdom - it has no basis in theory or practice.
There are numerous scholarly peer-reviewed papers about profiling, but none that I've read even address the point, let alone substantiate it.
It's a blind spot in academia, not a big one, but it's there.
Now to your question -
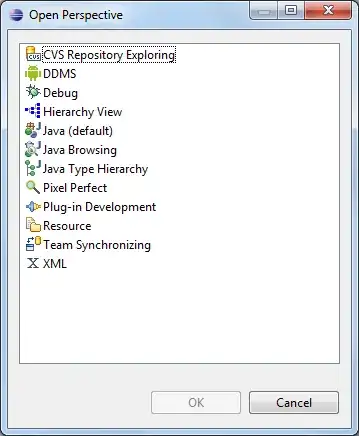
In the screenshot showing the call stack, that is what's known as the "hot path", accounting for roughly 60% of in-thread CPU time. Assuming the code with "saxon" in the name is what you're interested in, it is this:
net.sf.saxon.event.ReceivingContentHandler.startElement
net.sf.saxon.event.ProxyReceiver.startContent
net.sf.saxon.event.ProxyReceiver.startContent
net.sf.saxon.event.StartTagBuffer.startContent
net.sf.saxon.event.ProxyReceiver.startContent
com.saxonica.ee.validate.ValidationStack.startContent
com.saxonica.ee.validate.AttributeValidator.startContent
net.sf.saxon.event.TeeOutputter.startContent
net.sf.saxon.event.ProxyReceiver.startContent
net.sf.saxon.event.ProxyReceiver.startContent
net.sf.saxon.event.Sink.startContent
First, this looks to me like it has to be doing I/O, or at least waiting for some other process to give it content. If so, you should be looking at wall-clock time, not CPU time.
Second, the problem(s) could be at any of those call sites where a function calls the one below. If any such call is not truly necessary and could be skipped or done less often, it will reduce time by a significant fraction.
My suspicion is drawn to StartTagBuffer and to validate, but you know best.
There are other points I could make, but these are the major ones.
ADDED after your edit to the question.
I tend to assume you are looking for ways to optimize the code, not just ways to get numbers for their own sake.
It still looks like only CPU time, not wall-clock time, because there is no I/O in the hot paths. Maybe that's OK in your case, but what it means is, of your 12-minute wall clock time, 11 minutes could be spent in I/O wait, with 1 minute in CPU. If so, you could maybe cut out 30 seconds of fat in the CPU part, and only shorten the time by 30 seconds.
That's why I prefer sampling on wall-clock time, so I have overall perspective.
By looking at hot paths alone, you're not getting a true picture.
For example, if the hot path says function F is on the hot path for, say 40% of the time, that only means F costs no less than 40%. It could be much more, because it could be on other paths that aren't so hot. So you could have a juicy opportunity to speed things up by a lot, but it doesn't get much exposure in the specific path that the profiler chose to show you, so you don't give it much attention.
In fact, a big time-taker might not show up at all because on any specific hot path there's always something else a little bigger, like new, or because it goes by multiple names, such as templated collection class constructors.
It's not showing you any line-resolution information.
If you want to inspect a supposedly high-cost routine for the reason for the cost, you have to look at the lines within it. There's a tendency when looking at a routine to say "It's just doing what it's supposed to do.", but if you are looking at a specific costly line of code, which most often is a method call, you can ask "Is it really necessary to do this call? Maybe I already have the information." It's far more specific in suggesting what you could fix.
Can it actually show you some raw stack samples?
In my experience these are far more informative than any summary, like a hot path, that the profiler can present.
The thing to do is examine the sample and come to a full understanding of what the program was doing, and the reason why, at that point in time.
Then repeat for several more samples.
You will see things that don't need to be done, that you can fix to get substantial speedup.
(Unless the code is already optimal, in which case it will be nice to know.)
The point is, you're looking for problems, not measurements.
Statistically, it's very rough, but good enough, and no problem will escape.