Hi Im currently wishing to label my polar bar chart in the form whereby the labels are all rotating by differing amounts so they can be read easily much like a clock. I know there is a rotation in plt.xlabel however this will only rotate it by one amount I have many values and thus would like to not have them all crossing my graph.
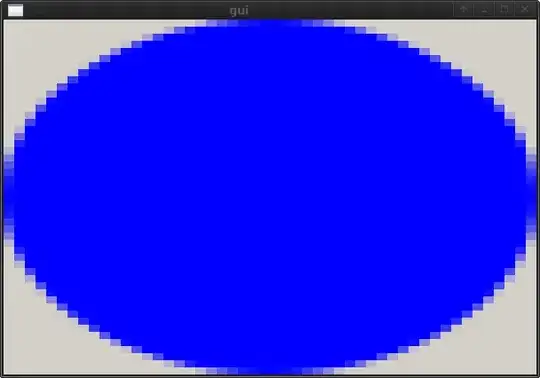
This is figuratively what my graph is like with all the orientations in the same way, however I would like something akin to this; I really need this just using matplotlib and pandas if possible. Thanks in advance for the help!
Some example names might be farming, generalists, food and drink if these are not correctly rotated they will overlap the graph and be difficult to read.
from pandas import DataFrame,Series
import pandas as pd
import matplotlib.pylab as plt
from pylab import *
import numpy as np


data = pd.read_csv('/.../data.csv')

data=DataFrame(data)
N = len(data)


data1=DataFrame(data,columns=['X'])
data1=data1.get_values()

plt.figure(figsize=(8,8))
ax = plt.subplot(projection='polar')
plt.xlabel("AAs",fontsize=24)
ax.set_theta_zero_location("N")
bars = ax.bar(theta, data1,width=width, bottom=0.0,color=colours)
I would then like to label the bars according to their names which I can obtain in a list, However there are a number of values and i would like to be able to read the data names.