25

I'm using caret package to model the data using rpart package.

library('caret')
data(iris)
formula <- as.formula(Species ~.)
t <- train(formula,iris,method = "rpart",cp=0.002,maxdepth=8)
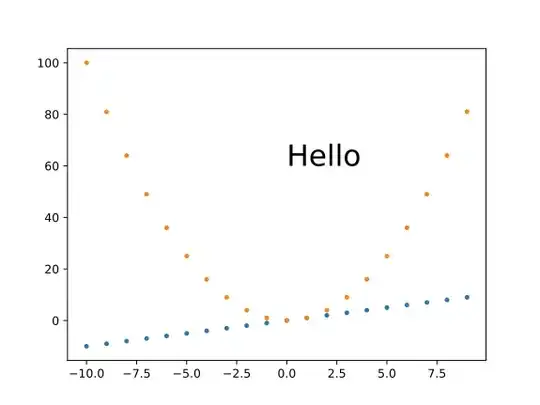
plot(t)

As a result I get object 't' and I'm trying to plot this object to get tree plot. But the result look like that: enter image description here

Are there any way to make a tree plot from caret train object?

Jot eN
  • 6,120
  • 4
  • 40
  • 59
  • If your tree plot is simple another option could be using "tree map" visualizations. Not the same as a treeplot, but may be another interesting way to visualize the model. See [treemapify](http://mlbernauer.github.io/R/20150309_treemaps_with_ggplot2.html) in ggplot – cacti5 Apr 10 '18 at 23:57

3 Answers3

51

nicer looking treeplot:

library(rattle)
fancyRpartPlot(t$finalModel)

enter image description here

Jot eN
  • 6,120
  • 4
  • 40
  • 59
32

The object returned from caret::train() is a list. The element finalModel contains your model.

Try this:

plot(t$finalModel)
text(t$finalModel)

enter image description here

Andrie
  • 176,377
  • 47
  • 447
  • 496
9

Had the same problem, but the answers given here wouldn't solve it, since I used a random forest instead of a tree, the following is for all coming here having the same issue:

In short: A tree can only be displayed when the method is something like:

method = "rpart"

Using a random forest

method = "rf"

will result in the following plot: enter image description here

Extended answer already here: Plot decision tree in R (Caret)

mrk
  • 8,059
  • 3
  • 56
  • 78