11

I'm trying to override the text in some ggplot strips to incorporate Greek characters. Here's some sample data, and the base for the plot.

dfr <- data.frame(
   x = rep(1:10, times = 6),
   y = runif(60),
   fx = rep(c("foo", "bar"), each = 30),
   fy = rep(c("alpha", "beta", "gamma"), each = 10, times = 2)
)

p <- ggplot(dfr, aes(x, y)) + geom_point()

My first attempt at a plot has no Greek in the strip labels.

 p + facet_grid(fy ~ fx)

I gather that I'm supposed to add a labeller argument to facet_grid to override the text. I presumed that this should spit out an expression to handle the greek characters, but my code just throws an error when the graphic is printed.

lbl <- function(variable, value)
{
   if(variable == "fy") parse(text=as.character(value)) else value
}
p + facet_grid(fy ~ fx, labeller = lbl)


Error in aperm(X, c(s.call, s.ans)) : 
  unimplemented type 'expression' in 'aperm'

How should I be creating the strip labels?
Richie Cotton
  • 118,240
  • 47
  • 247
  • 360

2 Answers2

10

Try this:

p + facet_grid(fy ~ fx, labeller = label_parsed)
Leo Alekseyev
  • 12,893
  • 5
  • 44
  • 44
  • I see that this answer works, but I can't figure out how. Where does label_parsed come from? I can't find it in the online ggplot docs. – kmm Mar 10 '10 at 19:30
  • 2
    It is mentioned briefly in the package docs (http://cran.r-project.org/web/packages/ggplot2/index.html); I agree that it could be better documented -- I only knew it b/c I've seen Hadley mention it at some point. – Leo Alekseyev Mar 10 '10 at 20:56
  • Thanks -- I see it now. That's a potentially very useful command. – kmm Mar 11 '10 at 04:03
4

posting this here since it's related:

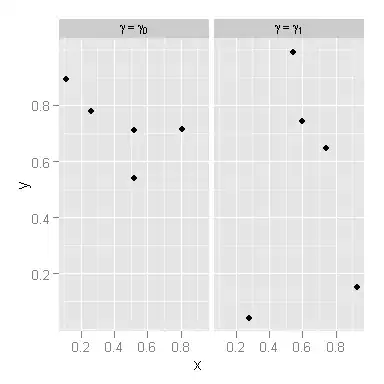
If you want the name of the variable itself as well as the levels/values of the variable to be evaluated as an expression (i.e. rendered as if they were latex), try this:

label_parseall <- function(variable, value) {
    plyr::llply(value, function(x) parse(text = paste(variable, 
        x, sep = "==")))
}

Example:

data <- data.frame(x = runif(10), y = runif(10), 
    gamma = sample(c("gamma[0]", "gamma[1]"), 10, rep = T))
ggplot(data, aes(x, y)) + geom_point() + facet_grid(~gamma, 
    labeller = label_parselabel) 

enter image description here

image at http://img709.imageshack.us/img709/1168/parseall.png

David LeBauer
  • 31,011
  • 31
  • 115
  • 189
fabians
  • 3,383
  • 23
  • 23