9

I'm completely stumped. I've been debugging for over a year and have only had this problem when the Build Configuration was set to Release. I have the Build Configuration set to Debug and I have checked to be sure I am attaching to the correct process and yet I still cannot see the values while stepping through the code. Has anybody else ran into this issue?

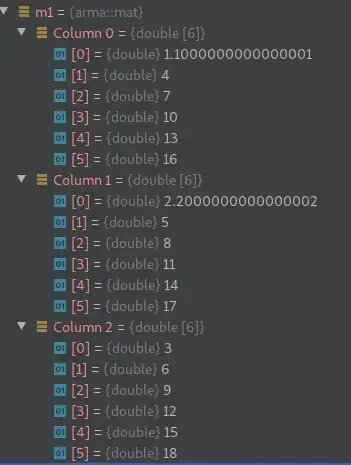
Here is a screen shot:

enter image description here

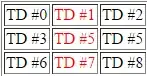
The value is returning, but I am unable to see the values of ANYTHING in this method or any of the other methods and I cannot figure out why.

Thank you for any hints you can give me.

============================== UPDATE ==================================

I've tried to print out the valued and this is the output I receive:

enter image description here

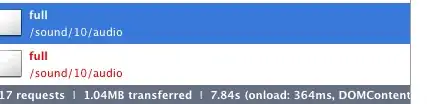
Notice though, that the value in the Variables view is correct for the result, even though I can't print it out. But the other values, like filePath should not be nil.

This is so weird.

============================== UPDATE ==================================

I put the breakpoint on the return statement and still no luck:

enter image description here

This time I see no value for result:

enter image description here

Patricia
  • 5,019
  • 14
  • 72
  • 152
  • Can you print them in the debugger? – Kevin Jun 05 '14 at 16:10
  • @Kevin - No I can't. I'll post another picture in update. – Patricia Jun 05 '14 at 16:34
  • @WarifAkhandRishi - I've rebooted. Nothing so far has fixed it. – Patricia Jun 05 '14 at 16:35
  • In the debugger if you write `p result`... what happens? – Warif Akhand Rishi Jun 05 '14 at 16:37
  • @WarifAkhandRishi - OK, p result returned this: (BOOL) $1 = NO – Patricia Jun 05 '14 at 16:43
  • http://stackoverflow.com/q/3321980/1378447 – Warif Akhand Rishi Jun 05 '14 at 16:47
  • did you do something to destroy your stack? – Brad Allred Jun 05 '14 at 16:58
  • what happens if you put a breakpoint on the `return result;` line? – Brad Allred Jun 05 '14 at 17:02
  • @BradAllred - I may have destroyed my stack. I'm not sure what you mean by stack. I went into Organizer and destroyed all projects yesterday. – Patricia Jun 05 '14 at 17:25
  • @WarifAkhandRishi - nothing there worked. Sorry – Patricia Jun 05 '14 at 17:47
  • I mean the execution stack. If you had a programming error that overwrites part of the stack you will corrupt the variables on the stack as well as the frames preventing debugger function (for obvious reasons). that doesnt look to be the case here, but if you are trying to debug this due to an odd crash it may be what is happening. – Brad Allred Jun 05 '14 at 18:56
  • Has anyone ever figured this out? I get it sporadically but when it happens the entire app is affected, some times for days. Then the problem goes away. It's very frustrating. – Ron Barr Feb 13 '15 at 04:53
  • @RonBarr In my case it was something messed up in my project. It was like I was stepping through a class but the project was hanging on to an old one or a different one. I had the same project outside of my Git Repository that I had been testing with. I opened that project and was able to see the values in the debugger and the two variables are set correctly. Not sure how to reset though, I'll have to look into it more or perhaps you can post how to do that. I hope this information helps. – Patricia Feb 13 '15 at 15:16

4 Answers4

9

@Lucy, ideally you shouldn't have to run in Release profile when debugging, Release is meant as an App Distribution profile with a small package size and little / no debug symbols.

But if you must debug on Release (e.g. due to Environment, data reasons), make sure you have the Optimization Level set to 'None' for Release.

Optimization level

You can reach the config above through:

1) Project wide settings - affects all Targets project wide

2) Target specific setting - affects a single Target only Target specific

Don't forget to switch this back before App Store distribution. Lower Optimization will generate a larger ipk increasing your users' download time - also the potential dSYM generated.

Background

For context, Debug, Adhoc or Release profiles are purely to id different build configurations that XCode ships with. XCode starts projects with a Debug profile with no Optimization (and various other predefined config related to development & debugging), so symbol loading by the interpreter is possible - you're free to tweak this however you wish.

Theoretically able to establish a Release build profile that's identical to Debug.

snowbound
  • 1,692
  • 2
  • 21
  • 29
9

I was facing the same issue, On mouse hover and watch section for every variable it was showing nil value but while NSLog for those variables it was printing correct value.

now it's fixed. Try this

Go to Product menu > Scheme > Edit scheme or +<

In Run go to Info tab, change the build configuration to "debug". Hope it will work.

Follow the same

Sujay
  • 2,510
  • 2
  • 27
  • 47
1

I do see part of your problem. notice how self is nil?

That means you are in a method call for a de-allocated object. Turn on NSZombies to debug.

see this SO answer for how to enable NSZombie

Given that it is legal to send messages to nil in objective-C, I would suspect that the object is being deallocated as a side effect of calling doesLicenseFileExist, or by another thread.

You may find it helpful to put a breakpoint in IDLicenseCommands -dealloc method.

Community
  • 1
  • 1
Brad Allred
  • 7,323
  • 1
  • 30
  • 49
  • Hey, Brad, it turned out not to be a zombie issue. I think there is something messed up in my project. I'm stepping through the code and there are two variables I expect to be a different value. It's like I'm stepping through a class but the project is hanging on to an old one or a different one. I have the same project outside of my Git Repository that I had been testing with. I opened that project and am able to see the values in the debugger and the two variables are set correctly. Any ideas how to fix that. Like clearing out some folder somewhere? – Patricia Jun 06 '14 at 15:39
  • 1
    @Lucy Comments below you post already linked to SO answers about deleting any files that may effect the debugger. If my original answer isn't the case and that other SO answer didnt help you (as you had indicated) I have to assume you are building with optimizations enabled. try disabling optimization. – Brad Allred Jun 08 '14 at 04:25
1

I had this problem, and turned "Link-Time Optimization" from "Incremental" to "No" and it resolved the debugging issue.

Corbin Miller
  • 395
  • 4
  • 13