I am trying to make the x-label colored, but I have no idea how to establish that. The difficulty is that I want to use LaTeX font and the package "amsmath".
My code is:
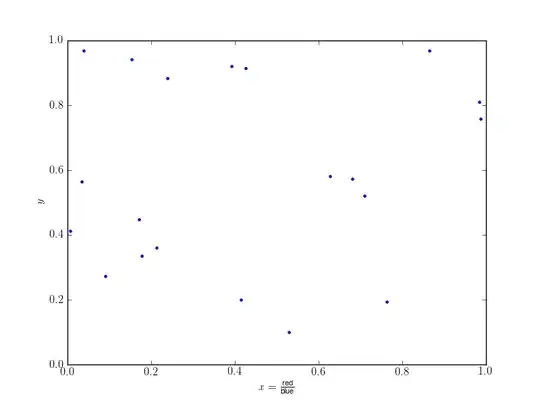
import math
import numpy as np
import matplotlib.pyplot as plt


x,y=np.random.rand(20),np.random.rand(20)


plt.figure()

plt.rc('text', usetex=True)
plt.rcParams['text.latex.preamble']=[r"\usepackage{amsmath}"]


plt.plot(x,y,'.')


plt.xlabel(r'$x=\frac{\text{red}}{\text{blue}}$')
plt.ylabel(r'$y$')

#plt.savefig('colored_labels.png')

plt.show()
Does anyone have a trick how to make the x-axis in the pronounced colors?
Thank you in advance!