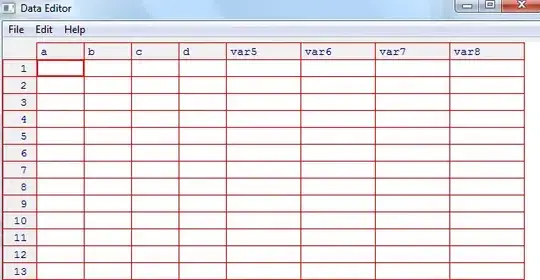
I want to create a visualization of a confusion matrix using matplotlib. Parameters to the methods shown below are the class labels (alphabet), the classification results as a list of lists (conf_arr) and an output filename. I am pretty happy with the result so far, with one last problem:
I am not able to center the axis tick labels between the gridlines. If I pass the extent parameter to the imshow method as below, the grid is aligned as I would like it to be. If I comment it out, the grid is missaligned but the labels are were I would like them to be. I think I need a way to move the ticklabel between the associated tick and the next tick but I do not know if and how this is possible.
To summarize, I want the grid/ticks like in the left image, but the ticklabels positioned like in the right image:
def create_confusion_matrix(alphabet, conf_arr, outputname):
    norm_conf = []
    width = len(conf_arr)
    height = len(conf_arr[0])
    for i in conf_arr:
        a = 0
        tmp_arr = []
        a = sum(i, 0)
        for j in i:
            tmp_arr.append(float(j)/float(a))
        norm_conf.append(tmp_arr)

    fig = plt.figure(figsize=(14,14))
    #fig = plt.figure()
    plt.clf()
    ax = fig.add_subplot(111)
    ax.set_aspect(1)
    ax.grid(which='major')
    res = ax.imshow(np.array(norm_conf), cmap=plt.cm.binary,
                    interpolation='none', aspect='1', vmax=1,
                    ##Commenting out this line sets labels correctly,
                    ##but the grid is off
                    extent=[0, width, height, 0]
                    )
    divider = make_axes_locatable(ax)
    cax = divider.append_axes("right", size="5%", pad=0.2)
    cb = fig.colorbar(res, cax=cax)

    #Axes
    ax.set_xticks(range(width))
    ax.set_xticklabels(alphabet, rotation='vertical')
    ax.xaxis.labelpad = 0.5
    ax.set_yticks(range(height))
    ax.set_yticklabels(alphabet, rotation='horizontal')
    #plt.tight_layout()
    plt.savefig(outputname, format='png')
The produced image looks like this: