19

EDIT

I found a quite nice solution and posted it below as an answer. The result will look like this:
enter image description here


Some example data you can generate for this problem:

codes = list('ABCDEFGH'); 
dates = pd.Series(pd.date_range('2013-11-01', '2014-01-31')); 
dates = dates.append(dates)
dates.sort()
df = pd.DataFrame({'amount': np.random.randint(1, 10, dates.size), 'col1': np.random.choice(codes, dates.size), 'col2': np.random.choice(codes, dates.size), 'date': dates})

resulting in:

In [55]: df
Out[55]:
    amount col1 col2       date
0        1    D    E 2013-11-01
0        5    E    B 2013-11-01
1        5    G    A 2013-11-02
1        7    D    H 2013-11-02
2        5    E    G 2013-11-03
2        4    H    G 2013-11-03
3        7    A    F 2013-11-04
3        3    A    A 2013-11-04
4        1    E    G 2013-11-05
4        7    D    C 2013-11-05
5        5    C    A 2013-11-06
5        7    H    F 2013-11-06
6        1    G    B 2013-11-07
6        8    D    A 2013-11-07
7        1    B    H 2013-11-08
7        8    F    H 2013-11-08
8        3    A    E 2013-11-09
8        1    H    D 2013-11-09
9        3    B    D 2013-11-10
9        1    H    G 2013-11-10
10       6    E    E 2013-11-11
10       6    F    E 2013-11-11
11       2    G    B 2013-11-12
11       5    H    H 2013-11-12
12       5    F    G 2013-11-13
12       5    G    B 2013-11-13
13       8    H    B 2013-11-14
13       6    G    F 2013-11-14
14       9    F    C 2013-11-15
14       4    H    A 2013-11-15
..     ...  ...  ...        ...
77       9    A    B 2014-01-17
77       7    E    B 2014-01-17
78       4    F    E 2014-01-18
78       6    B    E 2014-01-18
79       6    A    H 2014-01-19
79       3    G    D 2014-01-19
80       7    E    E 2014-01-20
80       6    G    C 2014-01-20
81       9    H    G 2014-01-21
81       9    C    B 2014-01-21
82       2    D    D 2014-01-22
82       7    D    A 2014-01-22
83       6    G    B 2014-01-23
83       1    A    G 2014-01-23
84       9    B    D 2014-01-24
84       7    G    D 2014-01-24
85       7    A    F 2014-01-25
85       9    B    H 2014-01-25
86       9    C    D 2014-01-26
86       5    E    B 2014-01-26
87       3    C    H 2014-01-27
87       7    F    D 2014-01-27
88       3    D    G 2014-01-28
88       4    A    D 2014-01-28
89       2    F    A 2014-01-29
89       8    D    A 2014-01-29
90       1    A    G 2014-01-30
90       6    C    A 2014-01-30
91       6    H    C 2014-01-31
91       2    G    F 2014-01-31

[184 rows x 4 columns]

I'd like to group by calendar-week and by value of col1. Like this:

kw = lambda x: x.isocalendar()[1]
grouped = df.groupby([df['date'].map(kw), 'col1'], sort=False).agg({'amount': 'sum'})

resulting in:

In [58]: grouped
Out[58]:
           amount
date col1
44   D          8
     E         10
     G          5
     H          4
45   D         15
     E          1
     G          1
     H          9
     A         13
     C          5
     B          4
     F          8
46   E          7
     G         13
     H         17
     B          9
     F         23
47   G         14
     H          4
     A         40
     C          7
     B         16
     F         13
48   D          7
     E         16
     G          9
     H          2
     A          7
     C          7
     B          2
...           ...
1    H         14
     A         14
     B         15
     F         19
2    D         13
     H         13
     A         13
     B         10
     F         32
3    D          8
     E         18
     G          3
     H          6
     A         30
     C          9
     B          6
     F          5
4    D          9
     E         12
     G         19
     H          9
     A          8
     C         18
     B         18
5    D         11
     G          2
     H          6
     A          5
     C          9
     F          9

[87 rows x 1 columns]

Then I want a plot to be generated like this: enter image description here That means: calendar-week and year (datetime) on the x-axis and for each of the grouped col1 one bar.
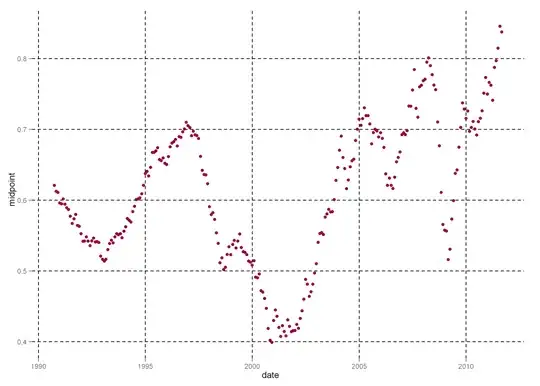
The problem I'm facing is: I only have integers describing the calendar week (KW in the plot), but I somehow have to merge back the date on it to get the ticks labeled by year as well. Furthermore I can't only plot the grouped calendar week because I need a correct order of the items (kw 47, kw 48 (year 2013) have to be on the left side of kw 1 (because this is 2014)).


EDIT

I figured out from here: http://pandas.pydata.org/pandas-docs/stable/visualization.html#visualization-barplot that grouped bars need to be columns instead of rows. So I thought about how to transform the data and found the method pivot which turns out to be a great function. reset_index is needed to transform the multiindex into columns. At the end I fill NaNs by zero:

A = grouped.reset_index().pivot(index='date', columns='col1', values='amount').fillna(0)

transforms the data into:

col1   A   B   C   D   E   F   G   H
date
1      4  31   0   0   0  18  13   8
2      0  12  13  22   1  17   0   8
3      3  10   4  13  12   8   7   6
4     17   0  10   7   0  25   7   4
5      7   0   7   9   8   6   0   7
44     0   0   2  11   7   0   0   2
45     9   3   2  14   0  16  21   2
46     0  14   7   2  17  13  11   8
47     5  13   0  15  19   7   5  10
48    15   8  12   2  20   4   7   6
49    20   0   0  18  22  17  11   0
50     7  11   8   6   5   6  13  10
51     8  26   0   0   5   5  16   9
52     8  13   7   5   4  10   0  11

which looks like the example data in the docs to be plotted in grouped bars:

A. plot(kind='bar')

gets this:

enter image description here

whereas I have the problem with the axis as it is now sorted (from 1-52), which is actually wrong, because calendar week 52 belongs to year 2013 in this case... Any ideas on how to merge back the real datetime for the calendar-weeks and use them as x-axis ticks?

tim
  • 9,896
  • 20
  • 81
  • 137
  • Comments should really go in comments. I know it's easy to get discouraged when not enough people answer the question, but the best thing to do then is *remove* non relevant parts from the question and to try and keep the question as quick-to-the-point as possible. – Veedrac Jun 13 '14 at 12:08
  • 2
    That wasn't a comment, really. Just a information for users which was very helpful for all readers... – tim Jun 13 '14 at 12:11

3 Answers3

9

I think resample('W') is a better way to do this - by default it groups by weeks ending on Sunday ('W' is the same as 'W-SUN') but you can specify whatever you want.

In your example, try this:

grouped = (df
    .groupby('col1')                
    .apply(lambda g:               # work on groups of col1
        g.set_index('date')        
        [['amount']]
        .resample('W').agg('sum')  # sum the amount field across weeks
    )
    .unstack(level=0)              # pivot the col1 index rows to columns
    .fillna(0)
)
grouped.columns=grouped.columns.droplevel()   # drop the 'col1' part of the multi-index column names
print grouped
grouped.plot(kind='bar')

which should print your data table and make a plot similar to yours, but with "real" date labels:

col1         A   B   C   D   E   F   G   H
date                                      
2013-11-03  18  0   9   0   8   0   0   4 
2013-11-10  4   11  0   1   16  2   15  2 
2013-11-17  10  14  19  8   13  6   9   8 
2013-11-24  10  13  13  0   0   13  15  10
2013-12-01  6   3   19  8   8   17  8   12
2013-12-08  5   15  5   7   12  0   11  8 
2013-12-15  8   6   11  11  0   16  6   14
2013-12-22  16  3   13  8   8   11  15  0 
2013-12-29  1   3   6   10  7   7   17  15
2014-01-05  12  7   10  11  6   0   1   12
2014-01-12  13  0   17  0   23  0   10  12
2014-01-19  10  9   2   3   8   1   18  3 
2014-01-26  24  9   8   1   19  10  0   3 
2014-02-02  1   6   16  0   0   10  8   13
patricksurry
  • 5,508
  • 2
  • 27
  • 38
3

Okay I answer the question myself as I finally figured it out. The key is to not group by calendar week (as you would loose information about the year) but rather group by a string containing calendar week and year.

Then change the layout (reshaping) as mentioned in the question already by using pivot. The date will be the index. Use reset_index() to make the current date-index a column and instead get a integer-range as an index (which is then in the correct order to be plotted (lowest-year/calendar week is index 0 and highest year/calendar week is the highest integer).

Select the date-column as a new variable ticks as a list and delete that column from the DataFrame. Now plot the bars and simply set the labels of the xticks to ticks. Completey solution is quite easy and here:

codes = list('ABCDEFGH'); 
dates = pd.Series(pd.date_range('2013-11-01', '2014-01-31')); 
dates = dates.append(dates)
dates.sort()
df = pd.DataFrame({'amount': np.random.randint(1, 10, dates.size), 'col1': np.random.choice(codes, dates.size), 'col2': np.random.choice(codes, dates.size), 'date': dates})

kw = lambda x: x.isocalendar()[1]; 
kw_year = lambda x: str(x.year) + ' - ' + str(x.isocalendar()[1])
grouped = df.groupby([df['date'].map(kw_year), 'col1'], sort=False, as_index=False).agg({'amount': 'sum'})
A = grouped.pivot(index='date', columns='col1', values='amount').fillna(0).reset_index()

ticks = A.date.values.tolist()
del A['date']
ax = A.plot(kind='bar')
ax.set_xticklabels(ticks)

RESULT:

enter image description here

tim
  • 9,896
  • 20
  • 81
  • 137
  • Wow, very nice, easy and clean solution. I like it. Not much hassle about matplotlib-axisticks :) –  Jun 15 '14 at 17:14
2

Add the week to 52 times the year, so that weeks are ordered "by year". Set the tick labels back, which might be nontrivial, to what you want.


What you want is for the weeks to increase like so

nth week → (n+1)th week → (n+2)th week → etc.

but when you have a new year it instead falls by 51 (52 → 1).

To offset this, note that the year increases by one. So add the year's increase multiplied by 52 and the total change will be -51 + 52 = 1 as wanted.

Community
  • 1
  • 1
Veedrac
  • 58,273
  • 15
  • 112
  • 169
  • What do you mean by "Add the week to 52 times the year"? When I group by the calendar-week, the datetimes are lost, which I'd need for my plotting :( – tim Jun 13 '14 at 11:15
  • aka. Don't group by week, group by `week + 52*year`. Although be careful about that 365th day... – Veedrac Jun 13 '14 at 11:32
  • Somehow I still dont get it. But maybe I jsut have to rethink about it for a while about why to add a multiple of 52 of the year to group by the returned value – tim Jun 13 '14 at 11:59
  • Ah now I see, you meant the delta_year*52, to have the real number of weeks since the start. – tim Jun 13 '14 at 12:19
  • 1
    Yes. Only it doesn't really matter if the years start on 2013 or so as it will just make the numbers larger (not the differences between them). – Veedrac Jun 13 '14 at 12:20