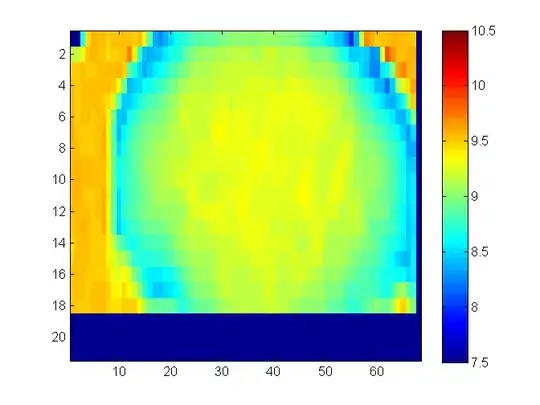
I have a two-dimensional matrix whose elements represent data that can be colormapped and represented as an image. I want to interpolate them, but I get strange behavior at some of the boundaries that I can't explain.
Here is the original image, the image after 3 iterations of the interpolation routine, and the image after 10 interpolation iterations.

Here's my code:
close all

ifactor = 0.9;  % Interpolation factor

% Cut out the meaningless stuff at the edges
bshift_i = bshift(1:16, 1:50);

[m, n] = size(bshift_i);

% Plot the initial data using colormapping
figure()
imagesc(bshift_i, [7.5 10.5])
colorbar()

% Main processing loop
for ii = 1:10
    % Every iteration, we generate a grid that has the same size as the
    % existing data, and another one that whose axis step sizes are
    % (ifactor) times smaller than the existing axes.
    [b_x, b_y] = meshgrid(1:ifactor^(ii - 1):n, 1:ifactor^(ii - 1):m);
    [b_xi, b_yi] = meshgrid(1:ifactor^ii:n, 1:ifactor^ii:m);

    % Interpolate our data and reassign to bshift_i so that we can use it
    % in the next iteration
    bshift_i = interp2(b_x, b_y, bshift_i, b_xi, b_yi);
end

% Plot the interpolated image
figure()
imagesc(bshift_i, [7.5 10.5])
colorbar()
I'm mainly wondering why the blue artifacts at the bottom and right edges occur, and if so, how I can work around/avoid them.